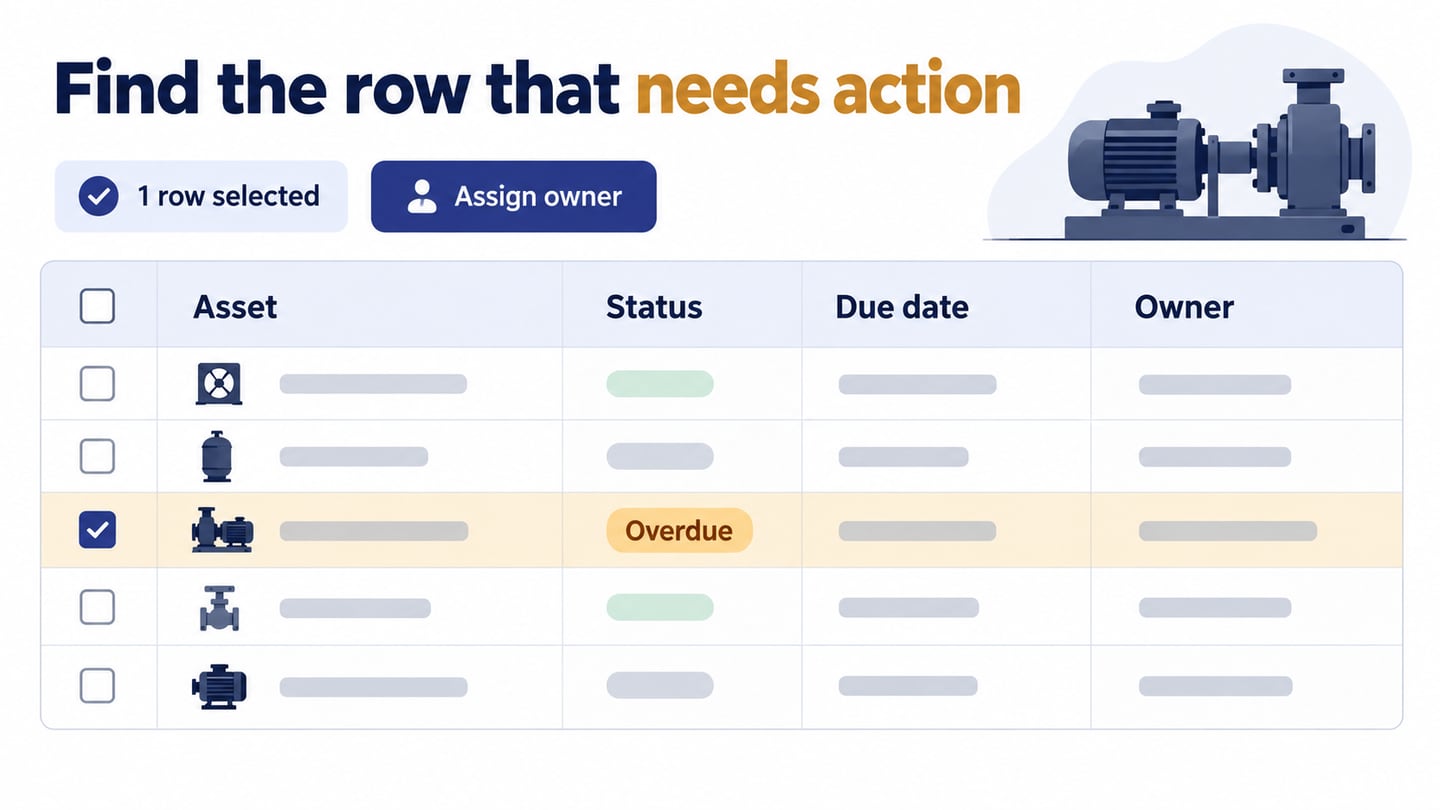
A data table helps people compare records and act on the relevant ones. This guide covers when to use tables, how to organize them and which patterns support different tasks. The goal is a usable relationship between rows, columns and actions rather than decoration.
We will examine five table patterns, then use a maintenance queue to show how sorting, selection and actions need to work together. A prototype can clarify those decisions; it does not implement a database or a responsive production table.
What Is Table UI Design?
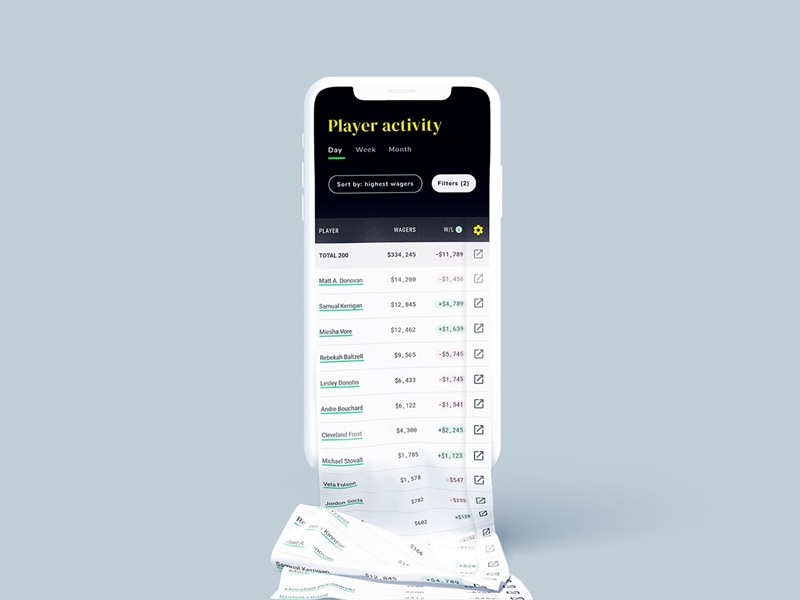
Table UI design arranges related information into rows and columns so people can scan and compare records. A row usually represents one item, while each column describes a consistent attribute of those items.
An interactive table may also provide links, filters, sorting and row actions. Those controls should support the user’s task without making it difficult to understand which record an action affects.
When and Why to Use a Table UI Design?
Use a table when people need to compare the same attributes across several records or find a particular record to act on. A very large dataset alone does not make a table the best choice; the comparison or decision is what matters.
A card layout may be better for visually browsing varied items, while a chart may communicate a trend more clearly. Avoid using a data table simply to arrange an unrelated page layout.
Here are a few benefits of using a UI table inside your page design:
- Efficient comparison: A consistent column makes differences between records easier to inspect without opening each item.
- Predictable organization: Clear headers and a stable row structure help people locate information.
- Controlled data display: Pagination or other loading strategies can limit what is fetched and rendered. A table layout by itself does not improve page speed. Compare pagination, Load more, and infinite scrolling around how people find and revisit a record.
- Focused decisions: Show the attributes necessary for the task and reveal less frequently needed detail separately.
- Clear actions: Tie a row or batch action to an explicit selection and communicate its scope.
How to Design a Table UI Design?
Begin with the decision the table needs to support. In a maintenance queue, a supervisor needs to find overdue work and assign an owner. Choose columns and actions around that task before deciding on borders or colors.
Carbon’s data-table guidance separates core rows and columns from optional features such as selection and expansion. Use that distinction to avoid adding every possible control to a simple table.
The original five practices below remain useful, but each has a task-dependent trade-off. Review both populated and empty states and include realistic long values.
1. Choose the Row Style
Choose a row treatment that helps the eye track across columns. Subtle horizontal rules or alternating backgrounds may help a dense table; a strong grid can become visual noise. Check that selection and error states remain distinguishable from the normal row style.
Common treatments include:
- A full grid for clearly separating cells when the content benefits from it.
- Horizontal rules to distinguish records with fewer vertical lines.
- Alternating row backgrounds to support tracking across a wide table.
- Minimal separators where spacing and alignment provide enough structure.
2. Table Headers
Headers name what each value means. Include units when needed, and make sortable columns identifiable. A sticky header can preserve context in a long table, but verify that it does not cover rows or consume too much of a small screen. In implementation, use appropriate table headers and associations as described in the W3C tables tutorial.
3. Text Alignment
Align values according to their meaning so comparisons are easy. Use consistent formats for dates, currencies and missing values; an empty cell and a numeric zero must not accidentally mean the same thing.
Useful starting points are:
- Right-align comparable numeric values and use consistent precision; identifiers may follow a different convention.
- Left-align text in left-to-right interfaces, allowing longer labels to wrap without obscuring actions.
4. Add Filter and Search Option
Search and filters should reflect the attributes people actually use. For the maintenance queue, an Overdue filter narrows the work, while a search can find a named asset. Keep active filters visible and explain a no-match state separately from an empty dataset.
5. Use Type and Color Consistently
Use color to reinforce a status, with a text label that carries the same meaning. Distinguish a selected row from a hovered row. Avoid making every column visually prominent; the table needs a hierarchy of importance.
Before settling the layout, also check what changes on a narrow screen. Horizontal scrolling may preserve a comparison, while a stacked record may support a different task. Do not hide an essential identifier or action solely to fit the table.
Five Table Patterns and Their Trade-offs
These five patterns preserve the original examples’ design ideas without treating copied screenshots as current templates. Select the pattern for the task and verify keyboard and touch behavior in the final implementation.
1. A Table with a Sticky Header
Keep column names visible while records scroll. This helps when someone must read values far down a list, but the header must stay aligned with the columns. Test zoom and narrow layouts so a sticky region does not obscure the data.
2. An Editable Table with Add-Row Controls
An add-row table lets someone enter several related records. Make draft and saved states distinct, show validation near the relevant cell and define what happens when a draft row is removed. Adding a row should not silently submit unrelated changes.
3. A Comparison Grid
A comparison grid places the same criteria against each option. Keep labels and units consistent, and distinguish Not included from information that is unavailable. Avoid filling the grid with decorative checkmarks that hide meaningful limitations.
4. A Table with Hover and Focus Feedback
A row highlight can help people follow a dense table. It must not be the only way to discover an action: touch screens have no reliable hover, and keyboard users need visible focus. Keep essential controls available without a pointer hovering over the row.
5. A Table with Alternating Row Backgrounds
Subtle striping can help track a record across several columns. It does not make a table responsive by itself. Check the contrast of text and selected rows, and avoid a stripe treatment that competes with status information.
Review a Table Task in Mockitt
A prototype makes table behavior easier to discuss before development. Use Mockitt to arrange representative records and connect the states needed for the review.
For a maintenance queue, create columns for Asset, Status, Due date and Owner. Show Pump A as overdue and Pump B as planned, using synthetic records. Let reviewers follow the proposed task of finding overdue work and assigning an owner.
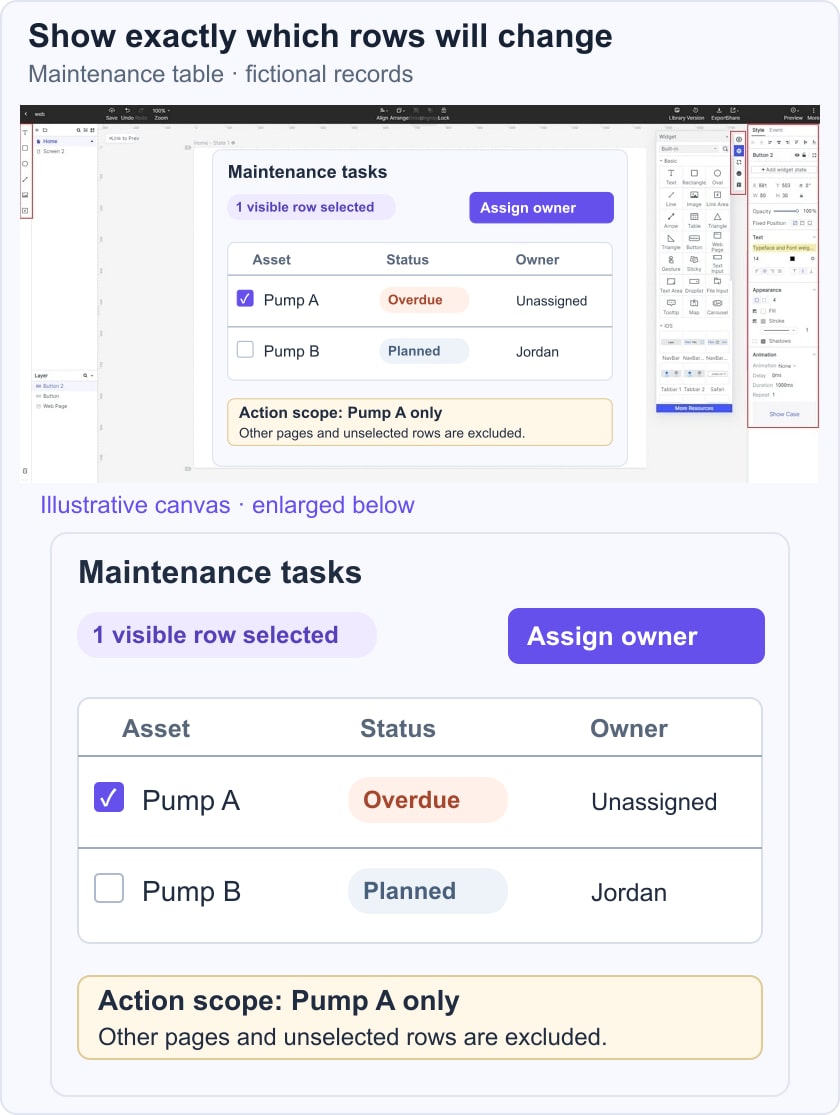
Represent the selected-row count and make the action scope explicit. If the example selects visible rows only, say so; do not let someone assume that records on other pages are included. Add a pending and failed assignment state without losing the selected record.
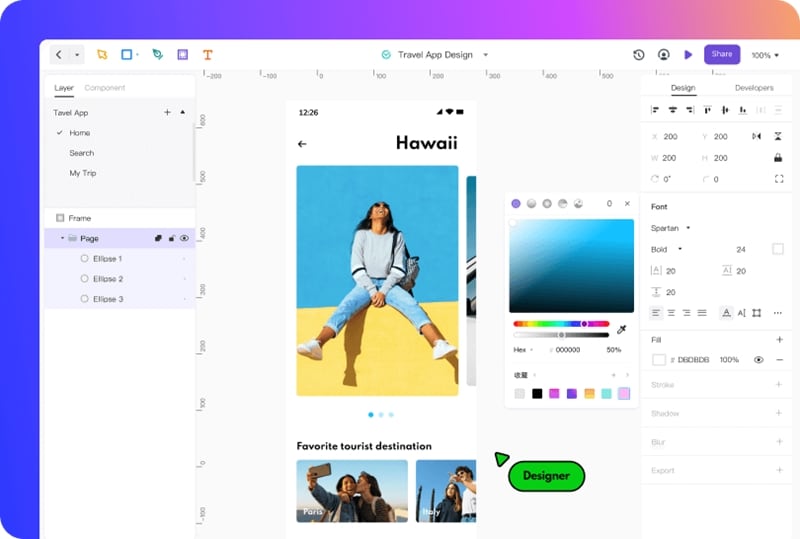
The retained Mockitt screenshot illustrates an earlier design workspace, not a live table implementation. Table semantics, data loading, sorting and permissions still need engineering and accessibility testing.
Use the Design Tool for Specific Questions
- Layout: Compare column widths, long names and missing values using realistic sample content.
- Reusable elements: Keep headers, cells and action styles consistent across the states under review.
- Feedback: Show when an action is pending, completed or failed; animation is optional.
- Linked states: Connect the filtered table to a row detail or assignment state, preserving the intended context.
- Handoff: Record sorting, selection and permission rules alongside the visual design. A code-free prototype is not a complete implementation.
Conclusion
A useful table lets someone locate a record, understand its values and perform the intended action with confidence. Start with that task, then choose the rows, columns and controls that support it. Validate the real table after implementation rather than assume the prototype proves performance or accessibility.