Business performance
Show the main result, then the trend or comparison that explains it. Link an exception to the relevant business detail.
Overview → comparison → detail
Mockitt · Dashboards and display prototypes
Make the important numbers easy to find.
Build a dashboard prototype for an operations room, a team wallboard, or a presentation screen. Plan the metrics, arrange the charts, and connect the details before the team builds the live system.
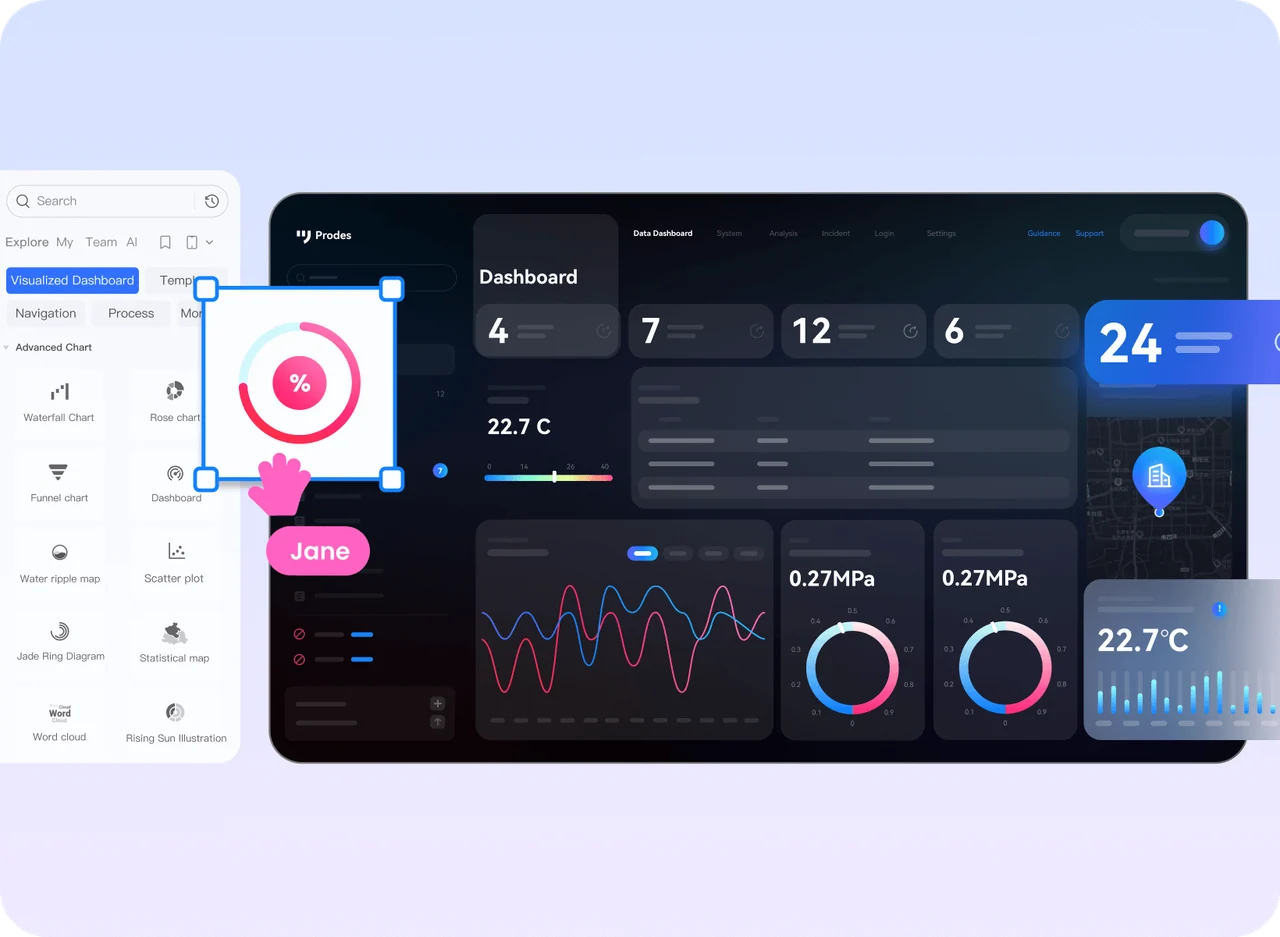
Begin with the decision
A large-screen dashboard combines key metrics, trends, locations, and events in a view people can scan. Choose the audience first, then decide what belongs in the overview and what needs a separate detail view.
Show the main result, then the trend or comparison that explains it. Link an exception to the relevant business detail.
Put equipment and incidents in context. Make the location, time, and next action clear when someone opens an event.
Group results by line or shift. Explain exceptions with text as well as color so a red indicator has an understandable meaning.
Example dashboard components · sample data
kWh per day · refresh time shown beside the metric
01 / Charts and components
In Mockitt Prototype, arrange the panels and reusable components around the decisions the dashboard supports. Give the primary metrics room to stand out before adding borders or decoration.
Keep the primary numbers short. Add a unit and period so the result can be interpreted without a separate legend.
Use bars for category comparisons and lines for changes over time. Separate metrics with incompatible scales.
Use a map when regions or physical assets matter. A simple bar chart is often clearer when the task is only to compare values.
02 / Overview to detail
For a facilities dashboard, an offline sensor in Area B should lead to an incident detail, then back to the same filtered view. Connect the screens and states so reviewers can follow that route.
Illustrative campus operations flow
Area B · temperature sensor offline
Sensor B-14
Last update: 10:42 a.m.
Next step: contact facilities
Area B remains selected. The same time range and incident list stay in view.
Keep the selected area, date, or shift visible when filters change. Show which panels are affected by the selection.
Distinguish loading, no records, stale data, and restricted access. Each state should tell the viewer what happens next.
Keep the time range and selected area after the detail closes. For rotating displays, define how to pause and resume.
03 / Screen size and viewing distance
Set up the design at the target aspect ratio, then check the density of metrics and chart labels. A layout that feels clear on a laptop may be unreadable from across a room.
1920 × 1080 and 3840 × 2160 are both 16:9. An ultrawide display needs a new grouping of panels, not a stretched version of the same page.
Review the smallest useful label and the most important alert from the distance where the display will be used. Keep critical text clear of physical screen seams.
Give rotating panels enough reading time. Use a transition or state change to explain an update, rather than making every panel move at once.
Layout planning · not to scale
16:9 display
1920 × 1080 or 3840 × 2160
32:9 display
Regroup the panels for a wider view
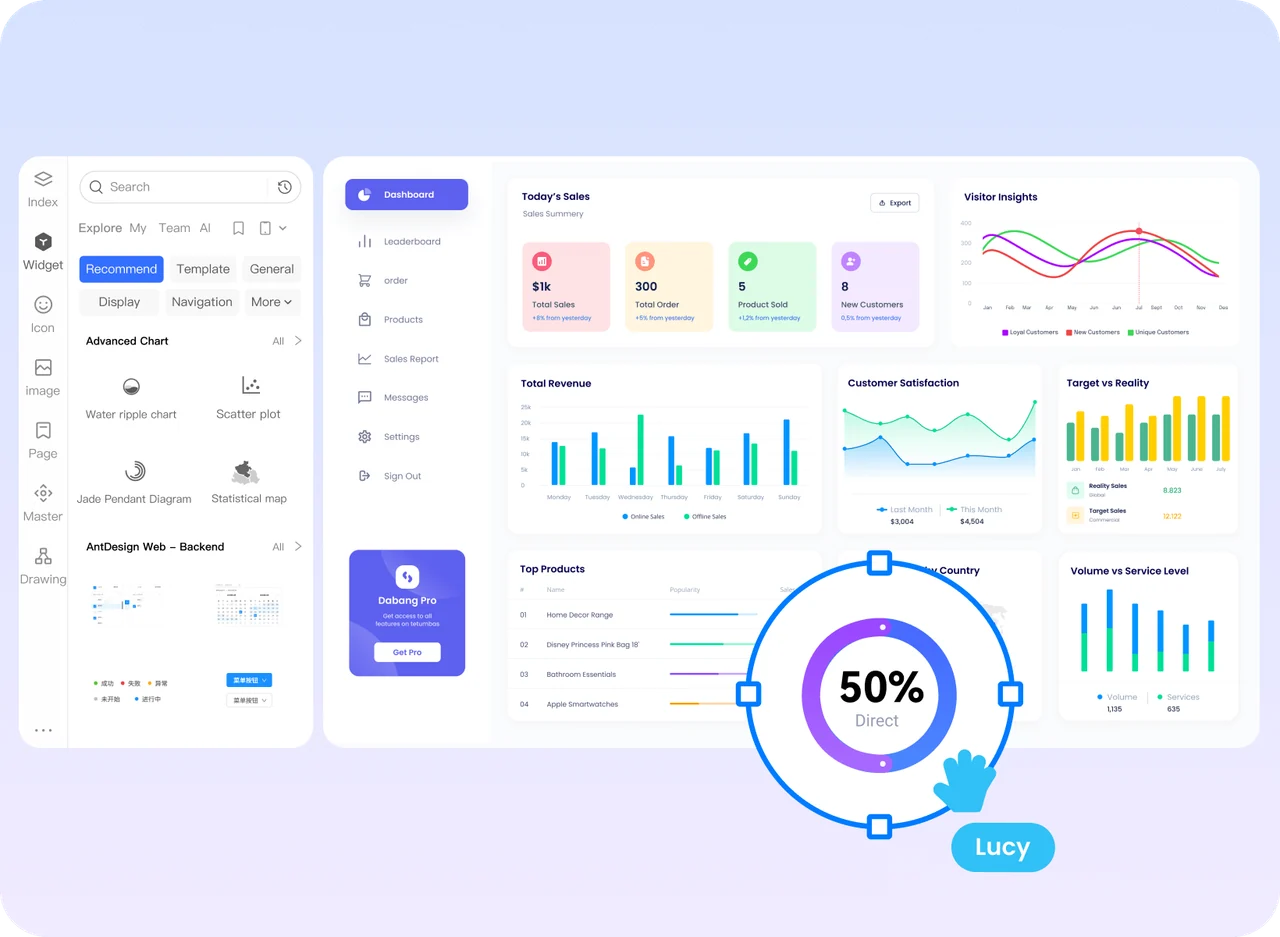
04 / Start with the right structure
Use a reference to get the hierarchy right, then replace the metrics, labels, and drill-down routes. Remove panels that do not help the viewer make a decision.
05 / Define the first draft
Choose a scenario and screen ratio to create an editable starting brief. Copy it for a team discussion or use it when you describe the project to Mockitt AI.
Start with sample data. Specify the audience, the decision, and the interaction before polishing the charts.
06 / Review and handoff
Share the prototype with product, design, and engineering. Walk through the overview, a key detail, and a failure state in the same review.
Confirm the audience, calculation, unit, time period, and threshold behind each metric.
Review hierarchy, contrast, viewing distance, filters, and the route back from a detail.
Agree on data fields, refresh behavior, access rules, and failure handling before production work.
Questions, answered
Yes. You can arrange screens and components, then connect the interactions in Mockitt. Use sample data to review the design before engineering connects the production data.
A wallboard emphasizes a quick overview and a few important states. A report usually supports closer reading, detailed queries, and analysis. Link the overview to a detail view rather than squeezing every table onto one screen.
A 1080p and 4K screen can share a 16:9 aspect ratio, but text and viewing distance still need checking on the device. An ultrawide screen changes the proportions and normally requires a different layout.
This page covers interface design and interaction prototypes. Production data connections, real-time processing, and alert delivery belong to the implemented system.
Write the audience, screen ratio, metrics, and key interactions in a brief, then use Mockitt AI to explore a draft. Check the meaning of the charts and the business rules before handing it off.
Make the next review count
Build a dashboard prototype your team can understand and review.