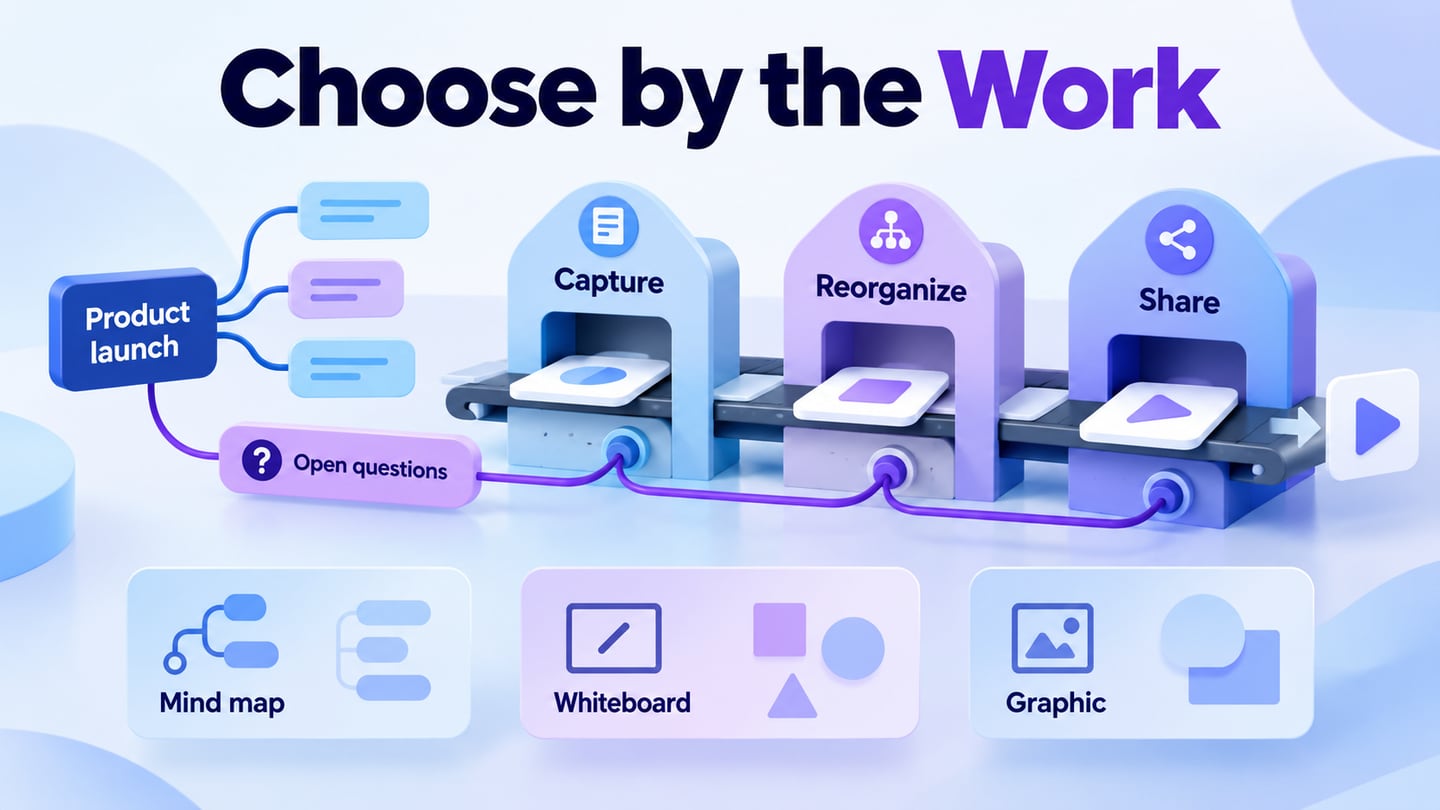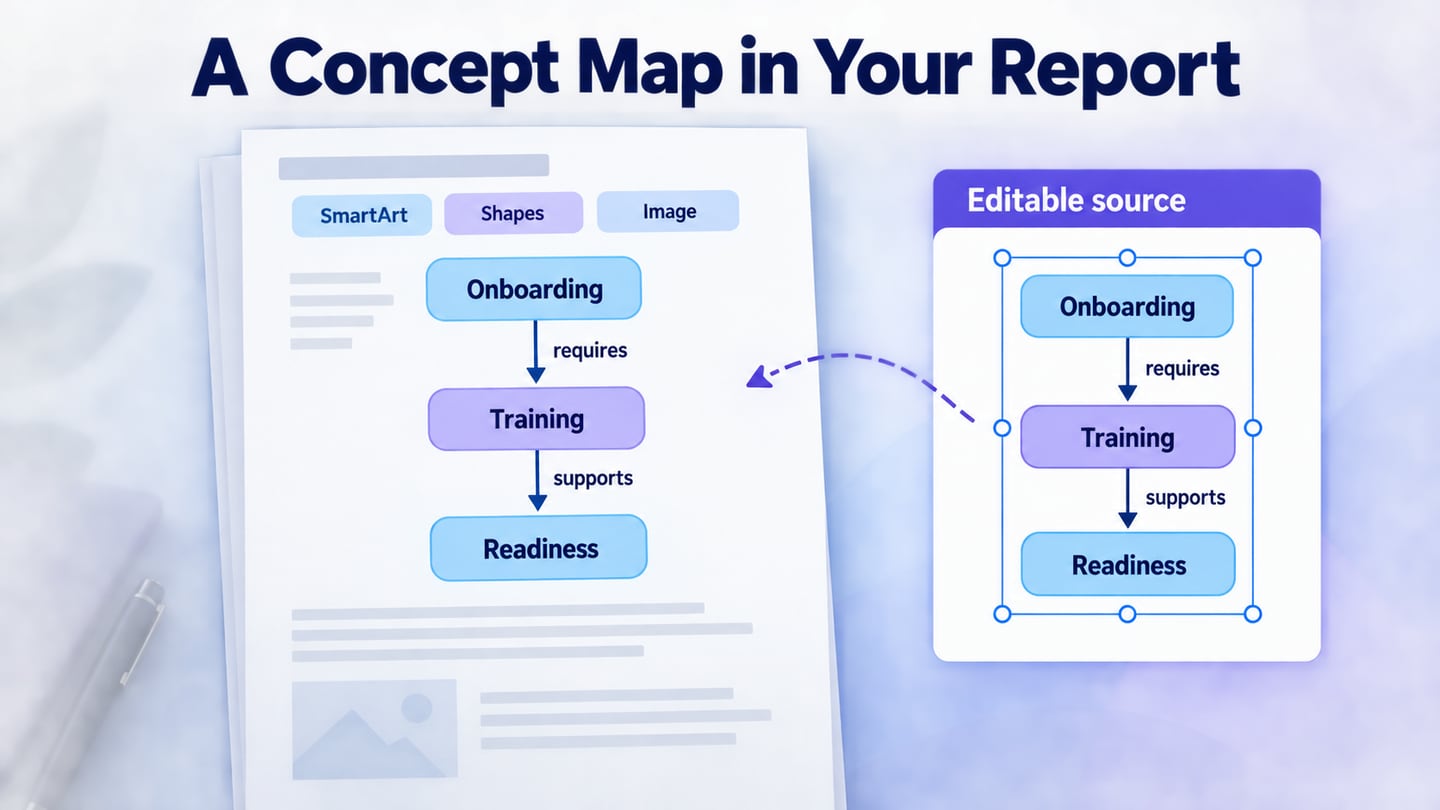
If your map belongs in a report, Word can hold both the explanation and the diagram. Build a simple hierarchy with SmartArt, use shapes for flexible relationships, or prepare the map on Mockitt’s online whiteboard and insert an image when Word only needs the finished view.
A concept map can help readers inspect how ideas relate. Its usefulness comes from clear concepts and connection labels, not an unsupported claim that most people have a particular learning style.
Before drawing, distinguish a concept map from a mind map. A branching outline names topics; a concept map also explains connections with phrases such as “requires” or “depends on.”
Compare three Word workflows, then check the essentials: choose the right structure, label relationships and keep an editable source. The retained screenshots show an earlier desktop Word interface; menu placement can vary by version.
Part 1: What is a concept map?
A concept map uses labeled connections to express relationships between concepts. Keep the topic narrow enough that another reader can explain the map without needing the author beside them.
For a report about customer onboarding, a useful statement is “Verified email enables account access.” The boxes name concepts and the phrase on the line explains the relationship. A line without a label may leave the reader guessing.
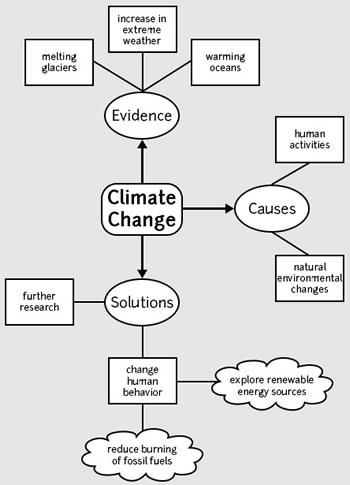
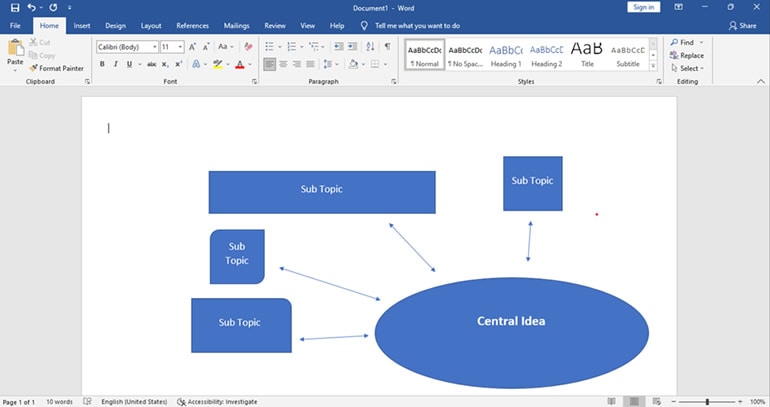
The original diagram below groups a broad topic into supporting ideas. Use it to understand spatial organization, then check that your own map has a focused question and meaningful links.
Part 2: How to create a concept map in Word using SmartArt?
SmartArt is suitable for a hierarchy with a predictable branching structure. Microsoft’s hierarchy instructions describe choosing a layout and adding text. For cross-links between branches, shapes are usually easier to control than forcing every connection into the hierarchy.
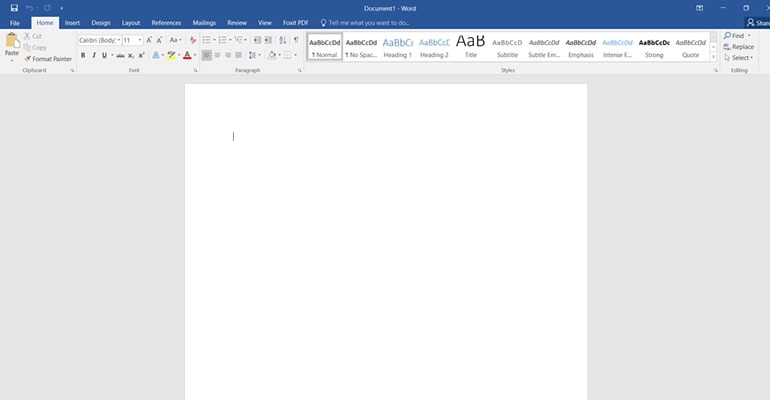
Step 1: Open a new Word document or place the cursor in the report section that will contain your diagram.
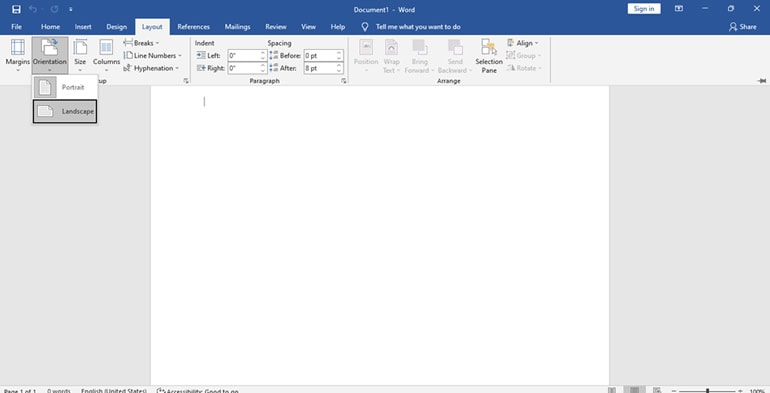
Step 2: If the map is wide, use Layout > Orientation > Landscape. For a single landscape page in a longer portrait report, manage section breaks so the rest of the document keeps its intended orientation.
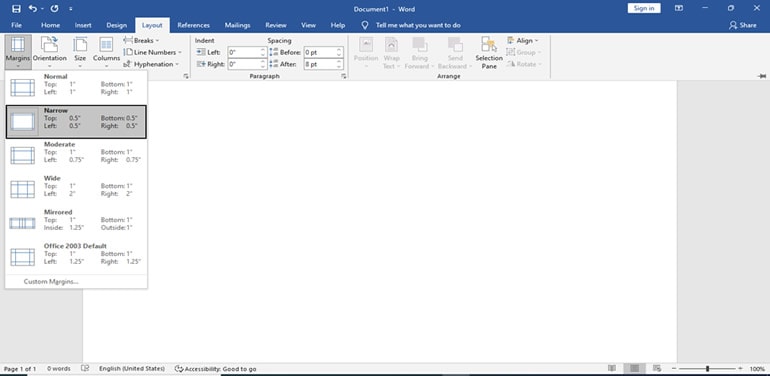
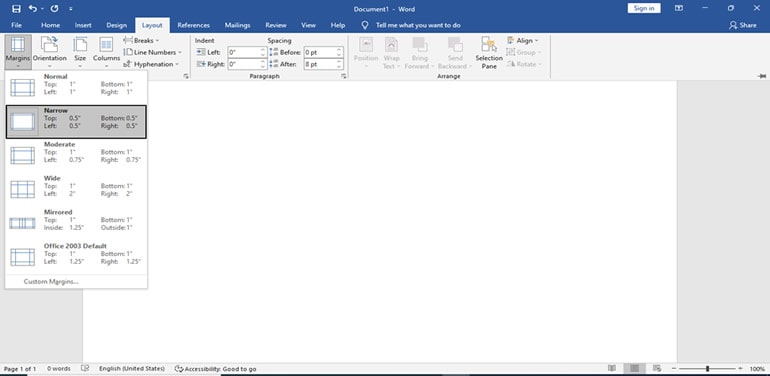
Step 3: Choose margins that leave enough room for readable labels. Narrow margins are optional, and the map should still fit the printable area required for the report.
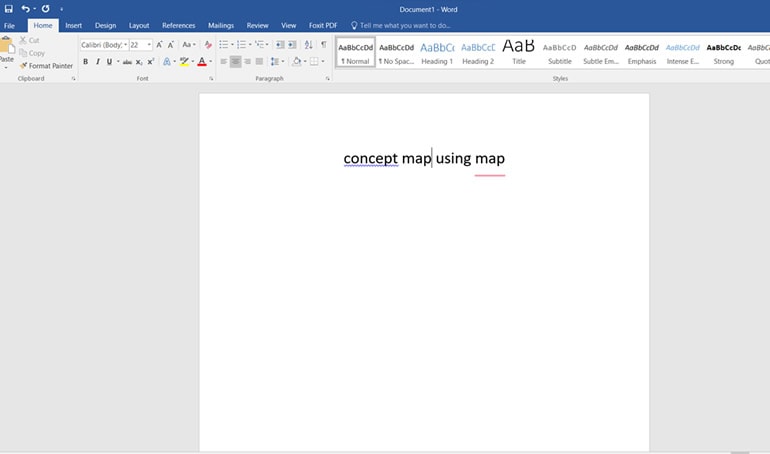
Step 4: Add a specific title or focus question, such as “What enables a new member to sign in?”
Step 5: Choose Insert > SmartArt > Hierarchy, then select a layout that matches the parent-child relationships. A horizontal hierarchy is one possible starting point.
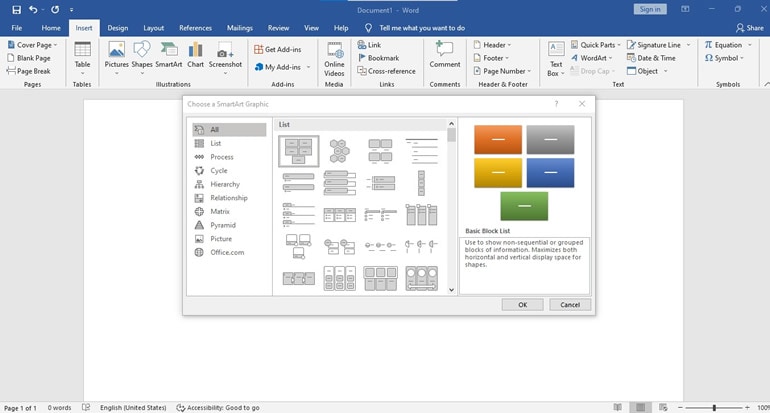
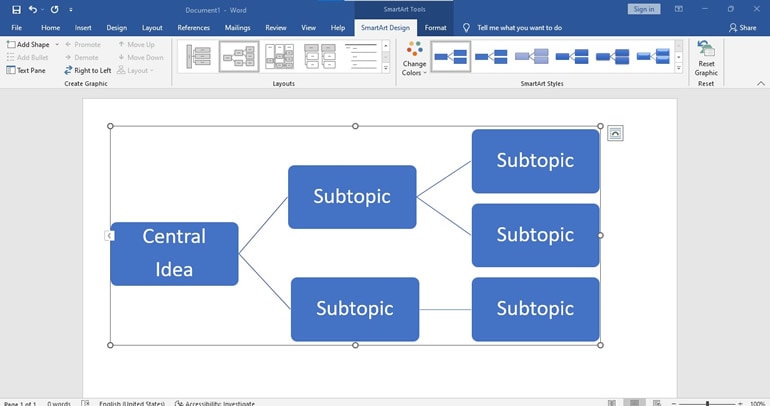
Step 6: Enter the main concepts in the Text pane or directly in the shapes. Keep labels short, add only necessary levels and review whether a hierarchy still represents the problem accurately.
For an onboarding report, put Account setup above Email verification and Profile completion. This groups the work, but it does not yet explain the rules. If the intended statement is “Email verification enables sign-in,” add that relationship explicitly with a shape-based map or a clear explanation alongside the hierarchy.
Part 3: How to create a concept map in Word using Shapes?
Use shapes when a concept needs several relationships or a connection crosses branches. You control the placement, connector direction and labels directly, at the cost of doing more layout work yourself.
Step 1: Create a blank area in the document for the map. A drawing canvas can help keep related shapes together in desktop Word.
Step 2: Set the page orientation to fit the content. Do not reduce every label simply to force a wide map into a portrait page.
Step 3: Adjust margins if necessary, keeping the report’s print and accessibility requirements in mind.
Step 4: Keep the page background simple. A colored background is optional; strong contrast and readable labels matter more than decoration.
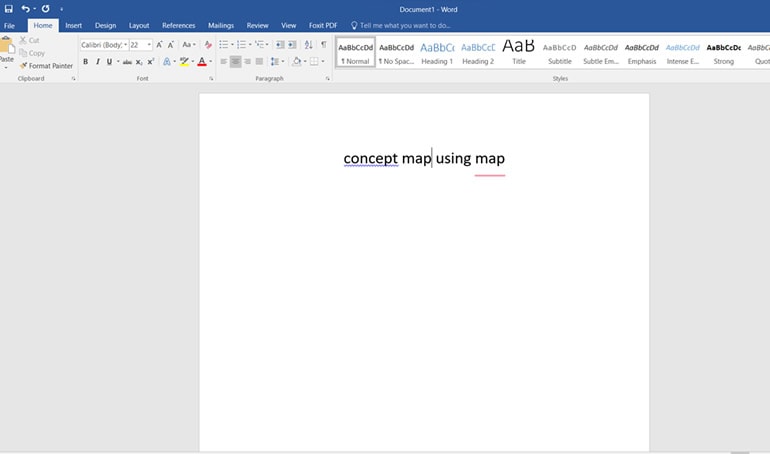
Step 5: Place the focus question above the drawing area, where it remains visible during review.
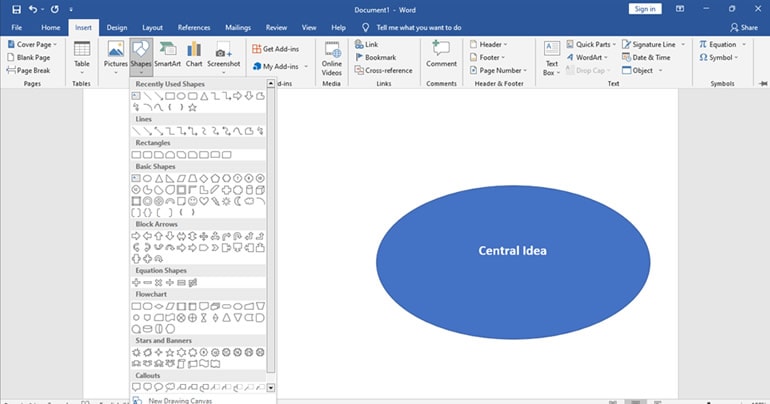
Step 6: Choose Insert > Shapes and add a shape for each concept. Use consistent shapes unless a difference carries meaning.
Step 7: Name the first concept “Account setup” and use similarly sized boxes for Email verification, Sign-in and Profile completion.
Step 8: Add only the supporting concepts needed to answer the focus question. Align them with space for connection labels.
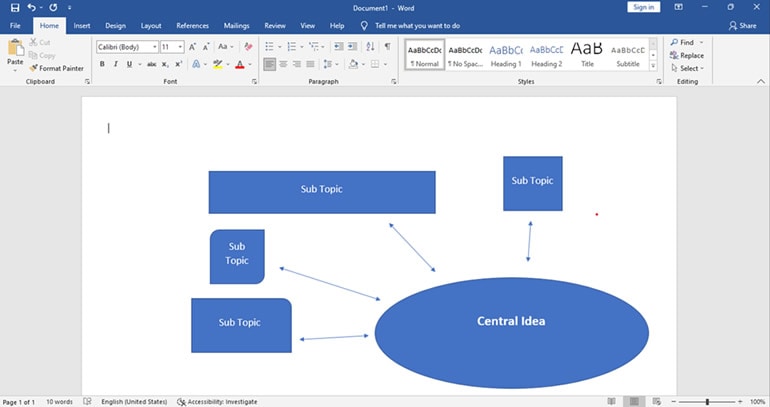
Step 9: Connect the concepts and add relationship phrases. For example, “Email verification enables Sign-in” and “Profile completion supplies Team directory details.” Move a box to check that its connector remains attached, then read each statement aloud.
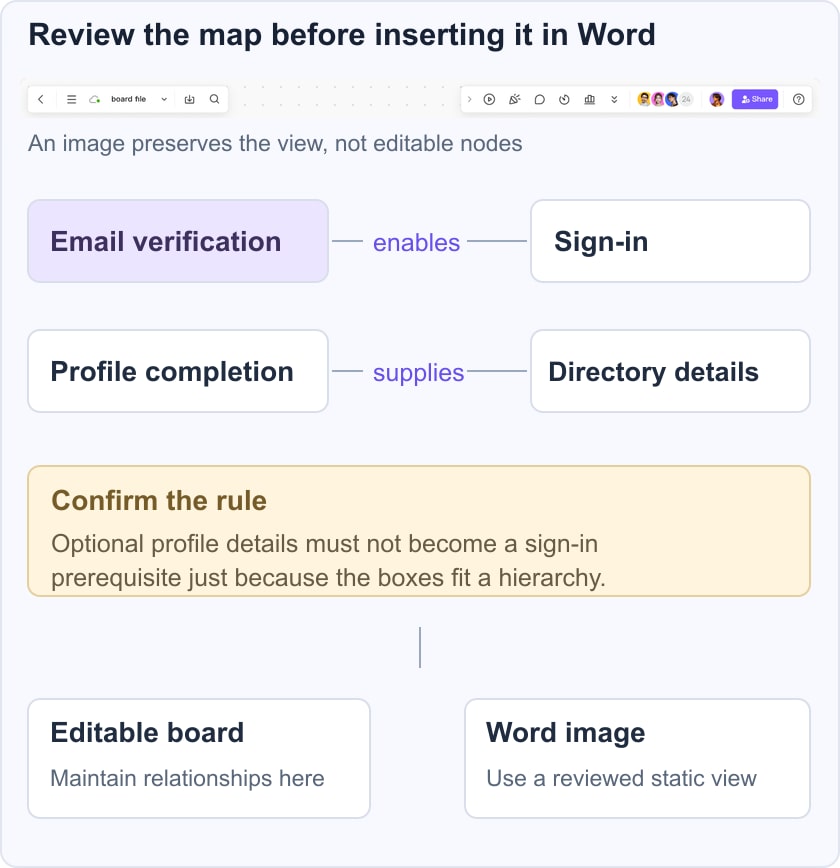
Check a second path before formatting. If Profile completion is optional, do not draw it as a prerequisite for Sign-in. Mark uncertain rules for the product owner to confirm. The drawing should capture a reviewed explanation, not invent a policy because the boxes fit neatly.
Part 4. How to create a concept map in a Word file with Mockitt?
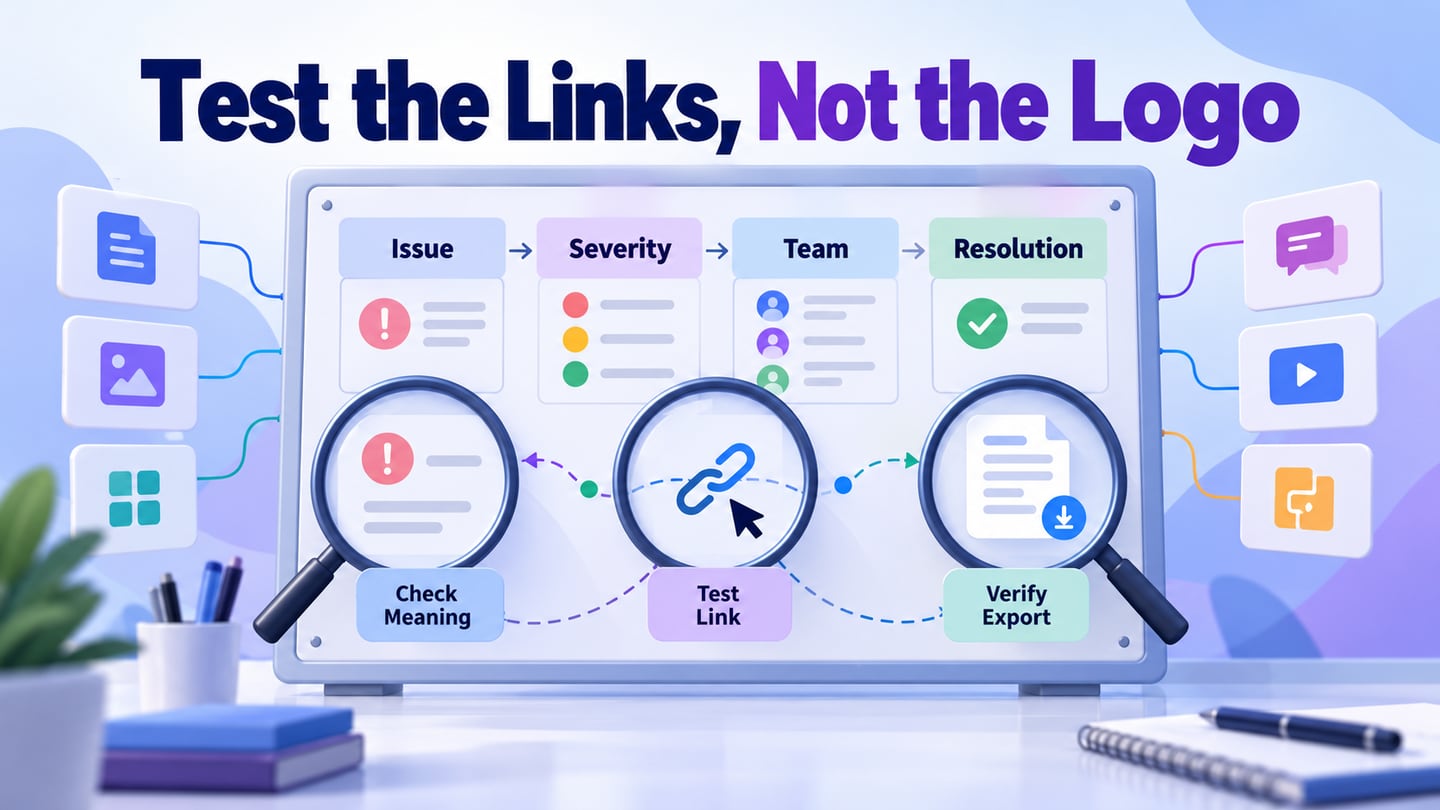
If the team will keep changing the relationships, it can be easier to review an editable map outside Word and place a static view in the report. The Word image is a presentation copy; the original map remains the source for later edits.
Create the concepts and links in the workspace, then check the map at the size it will appear on the document page. The historical editor screenshots below show the idea of working with nodes; current controls may differ.
Before exporting, check these practical requirements:
- The focus question and all relationship labels are readable at the final page width.
- The editable source remains available to the people who will maintain the report.
- Unconfirmed relationships are identified rather than presented as established facts.
Use this handoff sequence:
1. Open the current workspace and create a board or map appropriate to the task. No separate legacy account or download workflow is required by this guide.
2. Add the onboarding concepts and their labeled relationships. If a mind-map layout cannot express a cross-link clearly, use a freeform diagram instead.
3. Review the map before styling. Replace placeholder labels and remove unrelated branches from the report view.
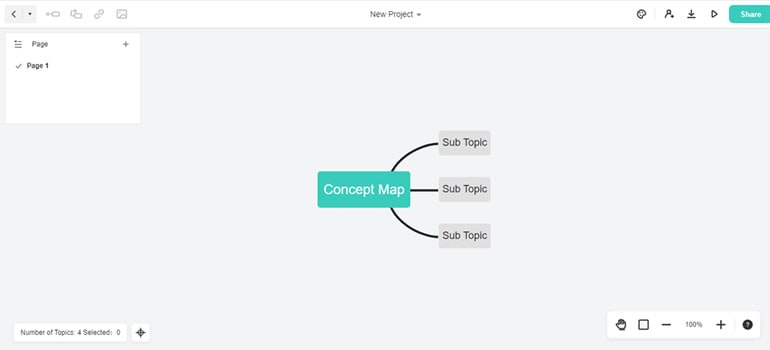
4. Apply a restrained color scheme and consistent text sizes. Color can group concepts, but the labels should communicate the same distinction without relying on color.
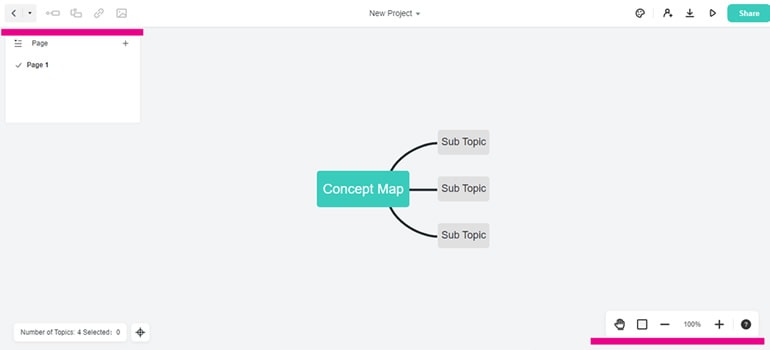
5. Use the export option available in your current workspace to save an image suitable for Word. PNG is a practical choice for a static diagram; inspect the saved file before inserting it.
6. In Word, put the cursor where the diagram belongs. Keep the map’s editable source separately, because a PNG will not become editable Word shapes.
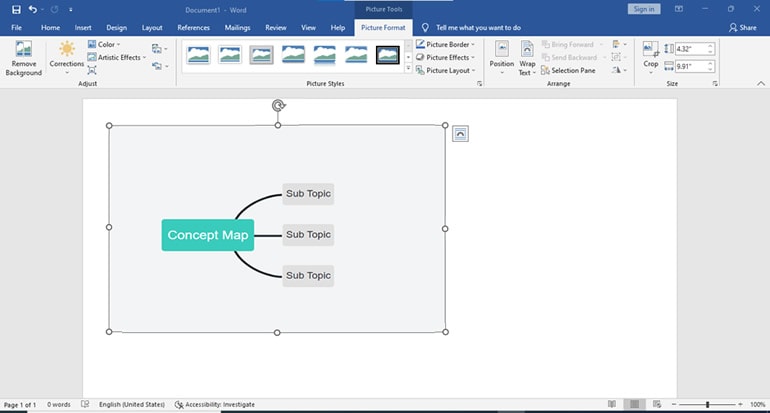
7. Choose Insert > Pictures and select the saved image.
8. Resize from a corner to preserve the aspect ratio. Add useful alt text and a caption explaining the map’s purpose.
Check the map before sharing the report
A successful map answers the focus question at the scale the reader will actually see. Use these checks before exporting the document or sending it to a colleague.
Organizing and managing ideas
Group related concepts, then inspect whether any important relationship crosses those groups. A neat hierarchy can still be incomplete.
If the map grows beyond a readable page, split it into a high-level view and a focused detail. The concept-map construction guide explains how to choose and refine the focus question.
The Visualization of Ideas
Open the report at normal reading size. Confirm that labels, arrow directions and connection phrases remain legible in the exported PDF as well as in Word.
Preserve the editable source
A static image is convenient for sharing, but it cannot preserve all of the original nodes and connectors. Store the editable map with the report and record which version the image represents. If collaborators use another document editor, see the Google Docs workflow.
Conclusion
Use SmartArt for a simple hierarchy, shapes for flexible labeled relationships, and an inserted image when Word only needs a reviewed view. Keep the source editable and test the final document at normal reading size.