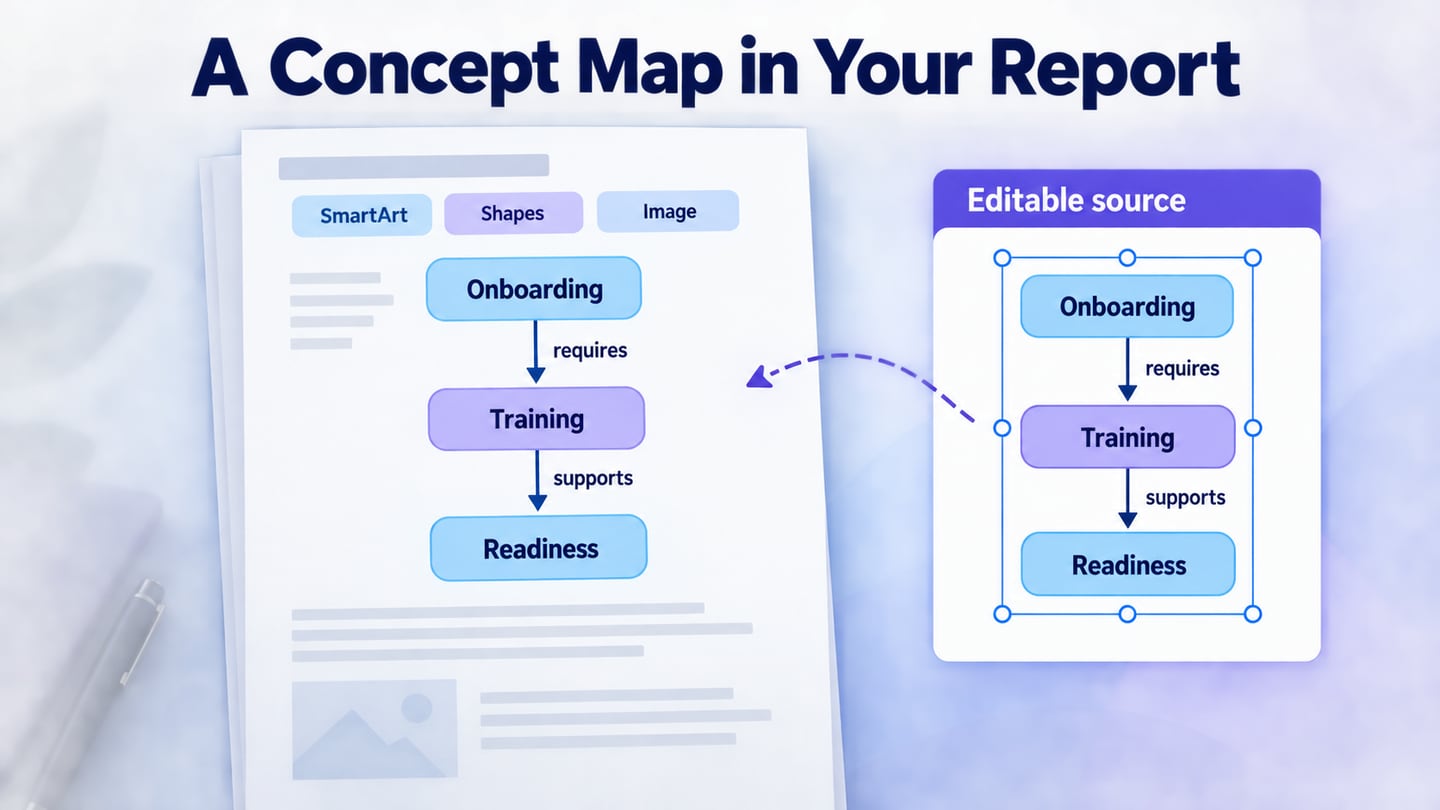
A double bubble map puts shared attributes between two subjects and their differences on the outside. You can sketch it on paper or use Mockitt’s collaborative whiteboard when a group needs to review and revise the comparison together.
Comparing two options is easier when both are described using the same criteria. A double bubble map makes common and unique attributes visible; it does not decide which option is better without a goal and evidence.
Follow the drawing steps through a concrete comparison: a live workshop and a self-paced course for new team members.
What Is a Double Bubble Map?
A single bubble map describes one subject with surrounding attributes. Keep those attributes specific enough that another reader can understand why they belong to the subject.
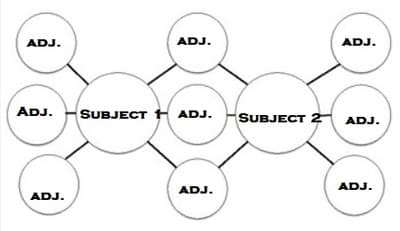
A double bubble map compares two subjects. Each subject has its own central bubble; shared attributes connect to both, while attributes unique to one subject sit on its outer side.
A Venn diagram also compares overlap and differences, using intersecting sets. A double bubble map is useful when separate labeled attributes are easier to read than text inside overlapping circles. Neither format is inherently superior.
Benefits of Double Bubble Maps
The map can make a discussion more balanced by requiring a team to name similarities as well as differences. It is especially useful when people are arguing for a favorite option without a common comparison framework.
For a group review, agree on the decision question first. One person can draft the attributes, another can challenge unclear claims, and the decision owner can identify the criteria that matter most.
Keep the evidence behind each attribute with the project notes. Reuse the structure for a later comparison, but verify the new information instead of copying the previous conclusion.
Difference Between a Bubble Map and a Double Bubble Map
The number of subjects is the visible difference: a bubble map describes one; a double bubble map compares two.
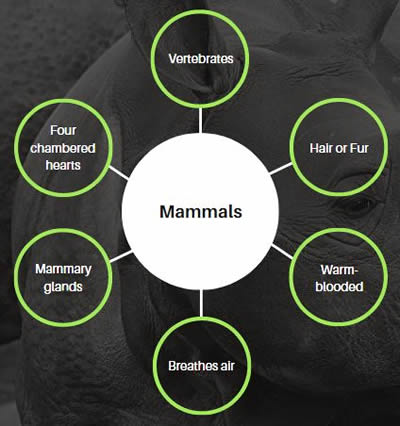
A single map might describe a live workshop using attributes such as scheduled, facilitated and interactive. Those labels become more useful when their meaning is explained in the context of the training task.
A double map adds a second subject and moves genuinely shared attributes into the middle. If your task is explaining how concepts relate rather than comparing two options, use a concept map instead.
When To Use a Double Bubble Map
Use a double bubble map to compare two products, service options, learning formats or proposed approaches. Avoid broad claims such as “cheaper” unless the basis for the comparison is clear.
A comparison does not need a winner. It may show that the right choice changes with the audience, time constraints or required outcome. Note those conditions beside the relevant attributes.
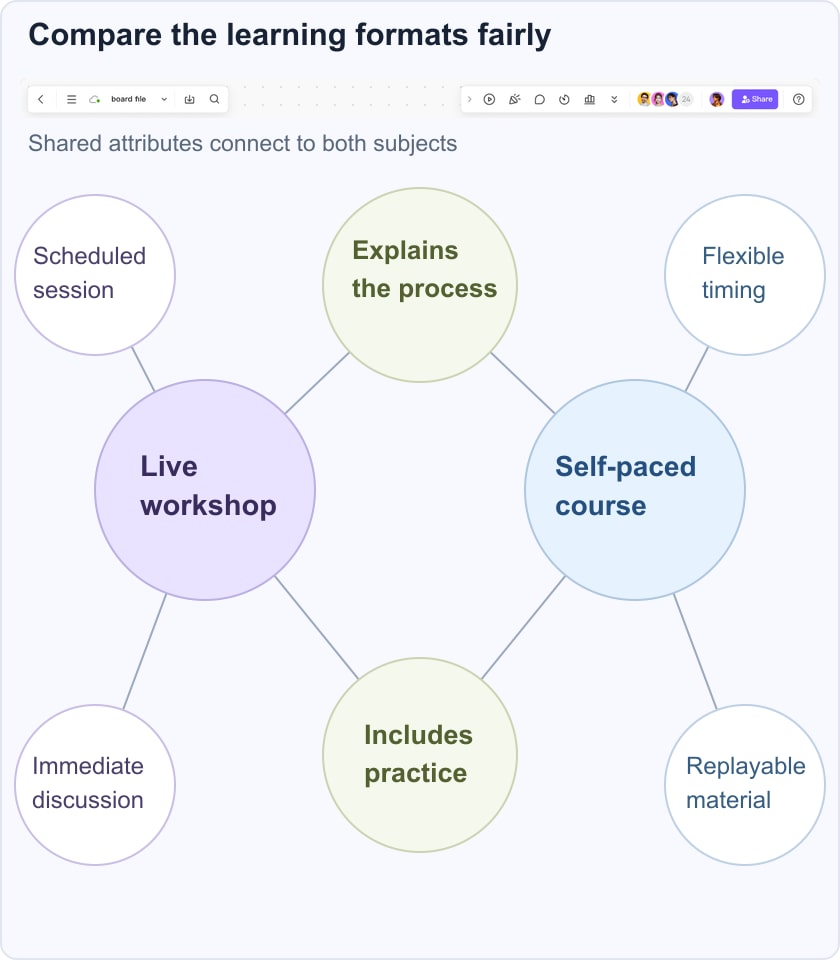
For onboarding, compare a live workshop with a self-paced course. Both can explain the team’s process and include practice. A live workshop has a scheduled session and immediate discussion; a self-paced course allows flexible timing and replayable material. These are characteristics of the example formats, not guarantees about every course.
If new starters join every week across time zones, flexible timing may matter more than a shared session. If the task involves discussing ambiguous cases, live conversation may be useful. Record the decision criterion separately: “New starters can practice the process and ask unresolved questions.” The map then supports a blended option without forcing a false either-or choice.
How to make a double bubble map
Build the comparison in five steps, using the same level of detail on both sides.
Step 1: Write the decision question above the map. For this example, use “How should new starters learn our review process?”
Step 2: Place two subject bubbles far enough apart to leave space for shared attributes between them.
Step 3: Label the subjects “Live workshop” and “Self-paced course.” Keep the scope comparable; do not compare an entire program with a single exercise.
Step 4: Place distinctive attributes on the outer sides. Use “Scheduled session” and “Immediate discussion” for the workshop, and “Flexible timing” and “Replayable material” for the course.
Step 5: Add shared attributes in the middle, connected to both subjects. In this example, use “Explains the process” and “Includes practice.” Read every attribute back against both formats, remove unsupported claims, then discuss which differences matter to the stated goal.
Keep the diagram uncluttered. If each subject needs dozens of attributes, group them or use a comparison table. A mind map serves a different purpose: it can expand the training topics before you compare delivery formats.
Double Bubble Map: Frequently Asked Question
These questions help decide whether the format fits your task.
1. What type of graphic organizer is a double bubble map?
A double bubble map is a comparison diagram. Its shared and unique attribute bubbles explain the similarities and differences between two named subjects.
2. Why is a double bubble map important?
It can expose vague comparisons and make a team’s criteria visible. It does not guarantee savings or growth; the quality of the decision depends on the evidence and the chosen criteria.
3. What thinking map is used for comparison and contrast?
Choose a Venn diagram when set membership and overlap are the main point. Choose a double bubble map when separate connected attributes are clearer. Use a table when many detailed criteria need side-by-side comparison.
Conclusion
The useful result is a comparison another person can inspect and challenge. Name the subjects precisely, use comparable attributes and keep unsupported opinions out of the map.
Choose the drawing method that makes review easiest for your team. If you need more mapping options, the concept-map tool guide explains what to test before selecting an editor.