You can make a simple concept map in Google Docs with a Drawing: open Insert → Drawing → New, add shapes for concepts, connect them with lines, and place a short relationship phrase on each connection. Use this approach for a small, mostly static map. When the map needs cross-links, review comments, or repeated editing, move the structure into a dedicated collaborative canvas such as Mockitt’s online board and keep the Google Doc as the written explanation.
Before drawing: define the relationship question
A concept map explains how ideas relate. Write the question above the canvas, such as “Why does activation fall after account verification?” List the concepts that must appear, then group them as causes, evidence, actions, outcomes, or constraints. The question prevents the drawing from becoming a collection of attractive but unrelated shapes.
Keep the first version small. Six to twelve concepts are easier to review than a page that contains every term in a project. Decide whether the map needs directional arrows and whether each line needs a linking phrase such as “causes,” “depends on,” “is measured by,” or “is an example of.”
Create the map in Google Docs
- Open a drawing. In Google Docs, choose Insert → Drawing → New. The labels can change as Google updates its interface, but the Drawing tool is the relevant workspace.
- Add concept shapes. Use one shape per concept and keep the text short enough to scan. Put the broadest concept near the top or center.
- Connect related concepts. Use lines or arrows from the shape controls. Place the relationship phrase near the line rather than relying on a color legend.
- Arrange the reading order. Group causes, evidence, and outcomes, then leave enough space for labels and cross-links.
- Save and review. Select Save and close to place the drawing in the document. Reopen it when you need to edit the map.
The exact toolbar labels may vary by account and language. Verify the visible command in your workspace before documenting a team procedure. The stable part of the workflow is the sequence: create a drawing, add concepts, connect relationships, save, and review.
Make the relationships readable
| Check | Weak map | Stronger map |
|---|---|---|
| Relationship | A line with no explanation. | A phrase that states how the concepts relate. |
| Direction | Arrows used for decoration. | Arrows used only when the relationship has direction. |
| Scope | Every project term on one canvas. | Only concepts needed to answer the stated question. |
| Evidence | Claims presented as facts. | Sources or notes attached to the concept or relationship. |
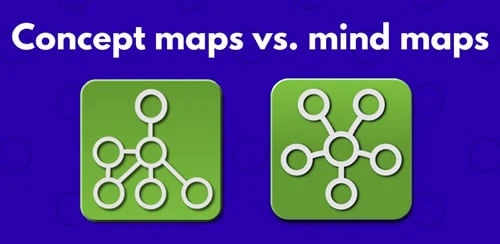
Read each path aloud: “Verification reduces account recovery risk” is meaningful; “Verification — account recovery risk” leaves the relationship open to interpretation. If a concept has several meanings, split it into separate nodes or add a clarifying phrase. Use alignment and spacing before adding more colors.
Review, export, and decide when to move
Ask a teammate to answer the map’s question using the drawing without an explanation. If they cannot find the evidence or follow a cross-link, shorten the labels, move the nodes, or remove an unnecessary connection. Check the map at the width where readers will see it in the document. A crowded drawing may be technically complete but still fail as a communication tool.
Google Docs works well when the map is small and lives beside a written brief. Consider a dedicated canvas when several people need to edit relationships, when the map has many cross-links, or when you need comments, revision history, and a larger workspace. Export a static image only after the editable source and the relationship labels have been reviewed.
Quick checklist
- The map answers one question.
- Every node is a concept, not a paragraph.
- Every important line has a readable relationship phrase.
- Arrows show direction only when direction matters.
- Sources, assumptions, and unresolved relationships are marked.
- The map remains legible in the document’s actual reading width.
A Google Docs Drawing is a useful lightweight starting point. Keep the question visible, label relationships, and move to a collaborative canvas when the map becomes a maintained product artifact rather than a one-time illustration.
Worked example: explain an activation drop
Start with “activation falls after verification” as the question. Add concepts for verification steps, message clarity, account recovery, support contacts, and activation outcome. Connect “unclear verification message” to “repeated attempts” with the phrase “increases,” then connect repeated attempts to support contacts with “drives.” A reviewer can read those paths as statements and challenge the evidence instead of guessing what a line means.
Keep evidence beside the concept or in the document below the drawing. If the relationship is only a hypothesis, label it as an assumption and link the research note. This prevents a visual connection from being mistaken for a measured causal claim.
Know the limits of a Google Docs Drawing
A Drawing is convenient for a small map inside a brief, but editing becomes slower as nodes and cross-links grow. It can also be difficult to compare revisions when many people move shapes at the same time. Decide whether the map is an illustration for one document or a maintained team artifact before you invest in polish.
Move the editable structure to a collaborative canvas when you need a larger workspace, comments attached to a relationship, repeated reorganizing, or a clear revision trail. Keep the Google Doc as the narrative: explain the question, summarize the evidence, and link to the current map. Do not keep two independently edited diagrams as competing sources of truth.
Questions for a final review
- Can a new reader state the map’s question after reading the title?
- Can they read three connections as complete sentences?
- Do arrows indicate direction, or are they merely visual decoration?
- Which relationships are evidence and which are still assumptions?
- Will the map remain legible when the Google Doc is printed or viewed on a narrow screen?