A data flow diagram (DFD) shows how information enters a system, is transformed or stored, and leaves it. You can draw one in a diagramming workspace, but its rules differ from an ordinary flowchart. This guide explains the elements, levels, and checks needed to make the model useful.
What is a Data Flow Diagram (DFD)?
A DFD represents information movement between external entities, processes, and data stores. Use a consistent notation and label the data on each flow.
The model helps define a system boundary and discuss what information each process needs or produces. It does not by itself specify the user interface, timing, or implementation technology.
A DFD is not a control-flow diagram: arrows represent data, not “do this next,” and decision diamonds do not describe branches in the usual DFD notation. Use a process flowchart when sequence and decisions are the main question.
Benefits of Data Flow Diagram
A DFD can expose missing information, unclear interfaces, and unexplained storage. Its value depends on the consistency of the model and the evidence behind it.
- Communication: Give stakeholders a shared view of the information crossing the system boundary.
- Requirements: Identify inputs, outputs, transformations, and records that need definition.
- Design discussion: Distinguish what the system must do with data from how it will be implemented.
Main Elements and symbols of Data Flow Diagram
A data flow diagram has 4 main elements: entity, process, data store, and data flow.
- External entity: A person, organization, or system outside the modelled boundary that sends or receives data.
- Process: An activity that transforms incoming data into outgoing data. Use a verb phrase that describes the transformation.
- Data store: Information retained for later use, such as a logical record collection. It need not correspond to a specific database product.
- Data flow: A named set of data moving between valid endpoints. Use a noun phrase such as “Registration details.”
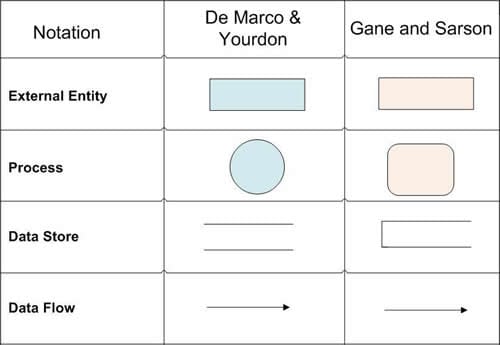
Yourdon-style and Gane–Sarson-style notation use different shapes for some elements. Choose one convention and use it consistently; the retained symbol comparison illustrates the distinction.
- Entities - rectangles with names.
- Process: Commonly a circle or rounded process shape, depending on the notation.
- Data store: Commonly parallel lines or an open-ended rectangle, depending on the notation.
- Data flow - arrows
Levels of Data Flow Diagrams
Begin with the system boundary, then decompose selected processes only as far as needed to answer the modelling question. More detail is not automatically a better model.
Naming conventions vary: some teams call the context diagram level 0, while others distinguish it from the first decomposed level. State the convention you use.
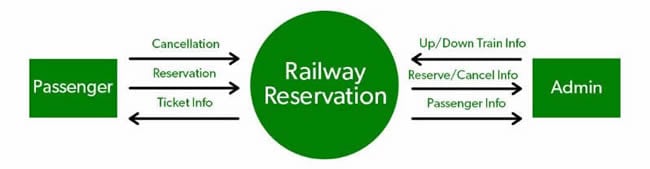
Context diagram: Represent the whole system as one process and show data exchanged with external entities. Internal stores and internal processes are not shown at this level.
First decomposition: Replace that single process with its main internal processes and relevant data stores, while preserving the external data flows represented at the boundary.
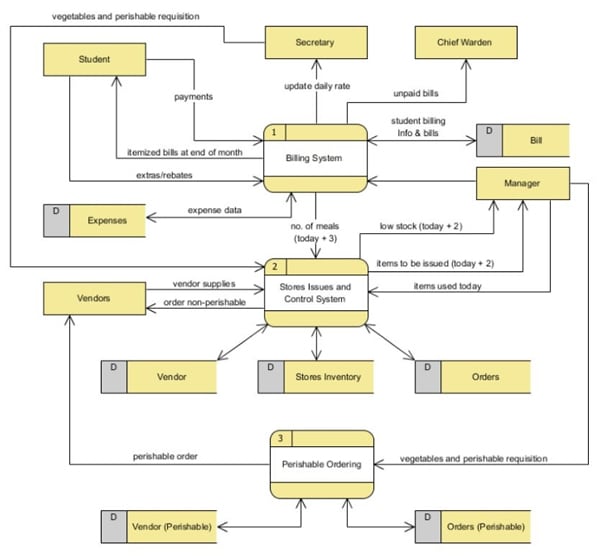
Further decomposition: Expand a selected process into a child diagram. Keep its inputs and outputs consistent with the parent process; this is often called balancing.
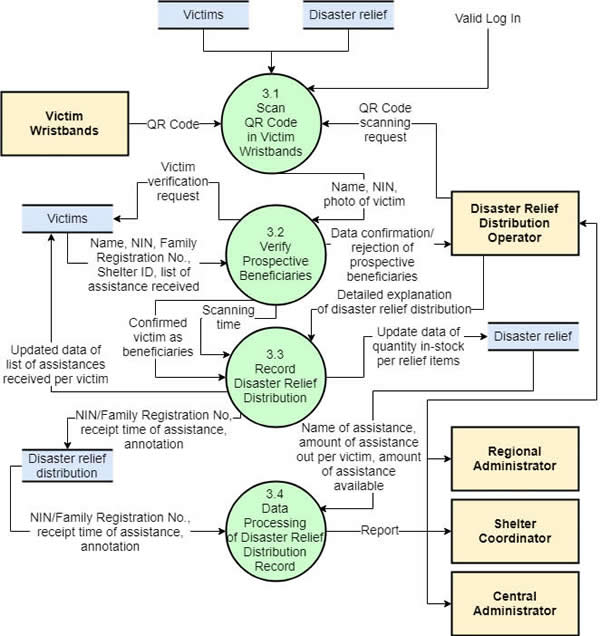
The original images below illustrate different levels using different subject areas. They are not a single system being progressively decomposed. Use one consistent example when checking your own parent-child balance.
How to Create a Data Flow Diagram?
Start with a bounded system and a clear reason for modelling its data. A small example is easier to validate before adding more detail.
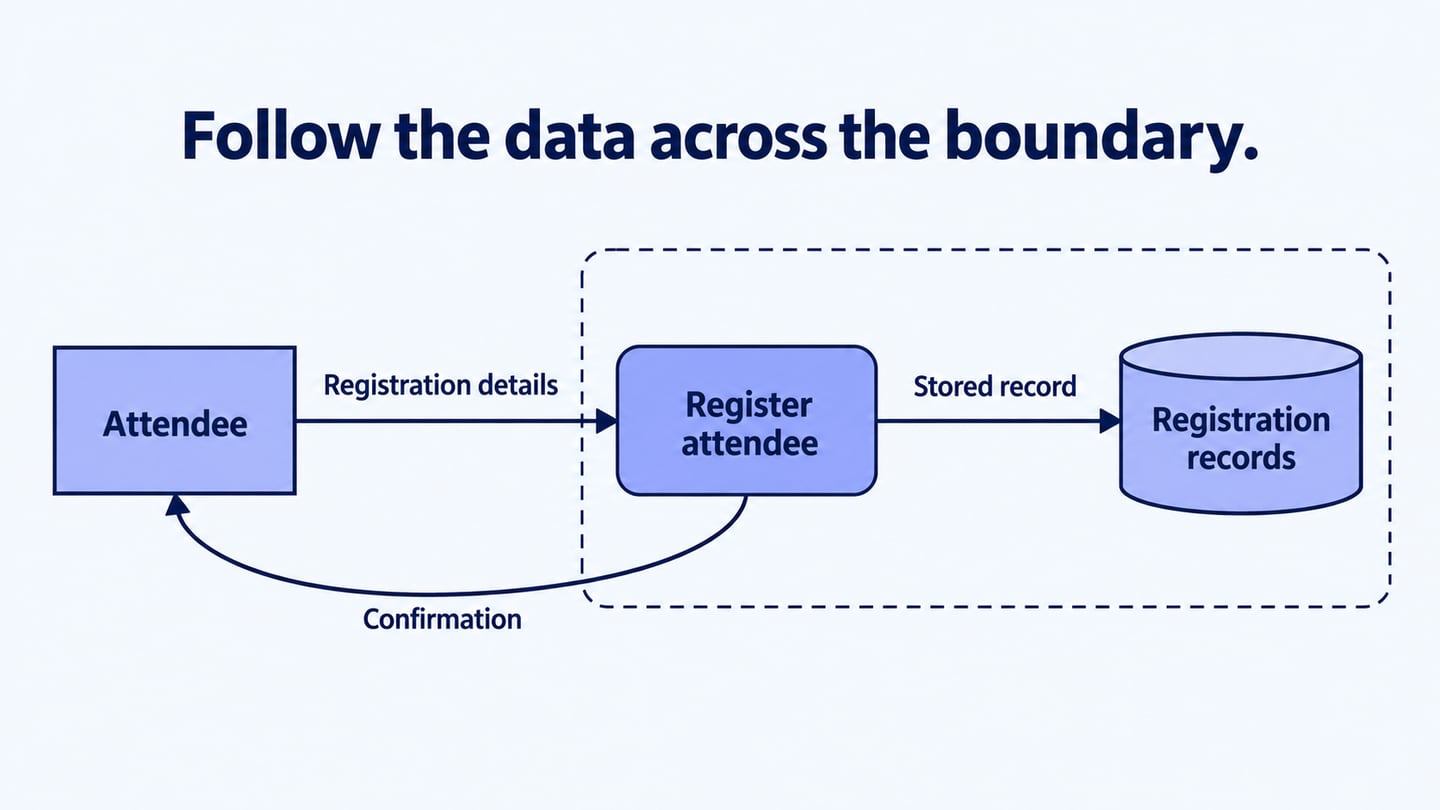
Use an event-registration system as a small example. An attendee supplies registration details, a registration process validates and records them, and a confirmation returns to the attendee. In a decomposed diagram, show the registration store and name the record written to it. Do not draw a direct attendee-to-database arrow: the process explains how the information is handled.
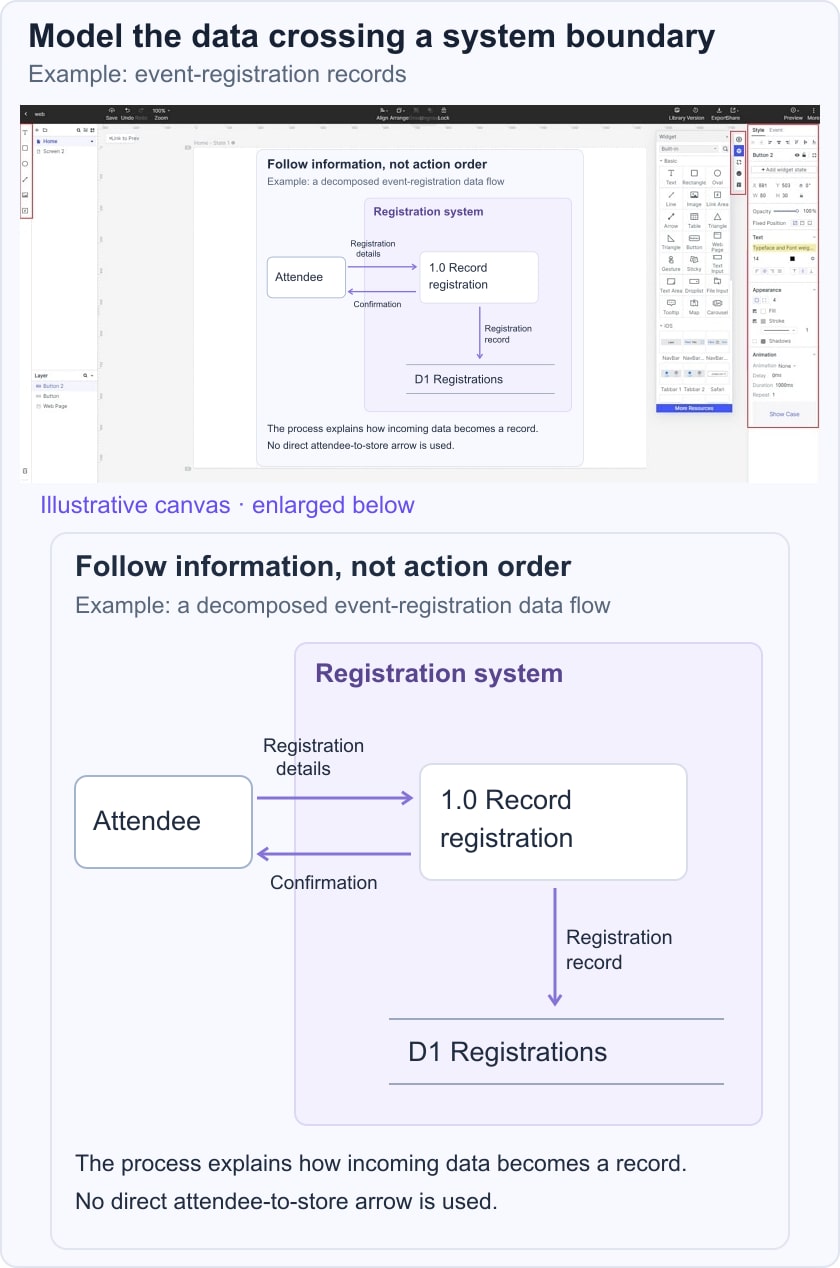
Use editable shapes and labelled connectors so the model can change as questions are resolved. The diagramming tool does not enforce the meaning of a DFD; the author and reviewers must check it.
Back to the steps for creating a data flow diagram:
Step 1: Define the boundary, purpose, external entities, and data exchanged with them.
Step 2: List the transformations and stored information. Separate actions from data names before drawing.
Step 3: Draw the context view with the system as a single process and named external flows.
Step 4: Check those flows with the people who know the system. Resolve missing or unexplained inputs and outputs.
Step 5: Decompose the system into its main processes and stores where more detail is useful.
Step 6: Compare the child and parent boundaries. The same information must still cross the boundary, even if it is divided into more detailed flows inside.
Step 7: Expand a process further only when needed, and repeat the balancing check after each change.
Data Flow Diagram Rules and Tips
Review the model for meaningful transformations, valid connections, and consistency between levels. These checks concern the data, not the number of arrows.
Rules:
- A process needs sufficient input to explain its output; avoid a process that creates information without an identified source or consumes it without a meaningful result.
- Show the relevant reads and writes for a data store in the model’s scope. A missing flow may reveal incomplete modelling, but do not invent an irrelevant operation simply to make the diagram symmetric.
- Do not compare the count of input and output arrows. One input may legitimately produce several outputs; the question is whether the output information can be explained by the inputs and transformation.
- External entities and stores interact through processes. Avoid direct entity-to-store or store-to-store data transfers in a logical DFD.
- Name stores for the information retained and show which processes use it.
- Give each data flow a descriptive name and a clear direction.
- Keep unrelated information separate unless it is genuinely exchanged as one meaningful data set.
- Do not add start/end timing or control-loop notation as though the DFD were a process flowchart.
Conclusion
A useful DFD makes the information and system boundary clear. Check the notation, transformation logic, and parent-child balance before sharing it.
Iterate on the affected part when a requirement changes rather than restarting the entire model unnecessarily. Record unresolved assumptions so the diagram does not present them as settled facts.
Connect the model to the product requirements that define the information and rules. A DFD supports that discussion; it does not replace the detailed requirement or implementation design.