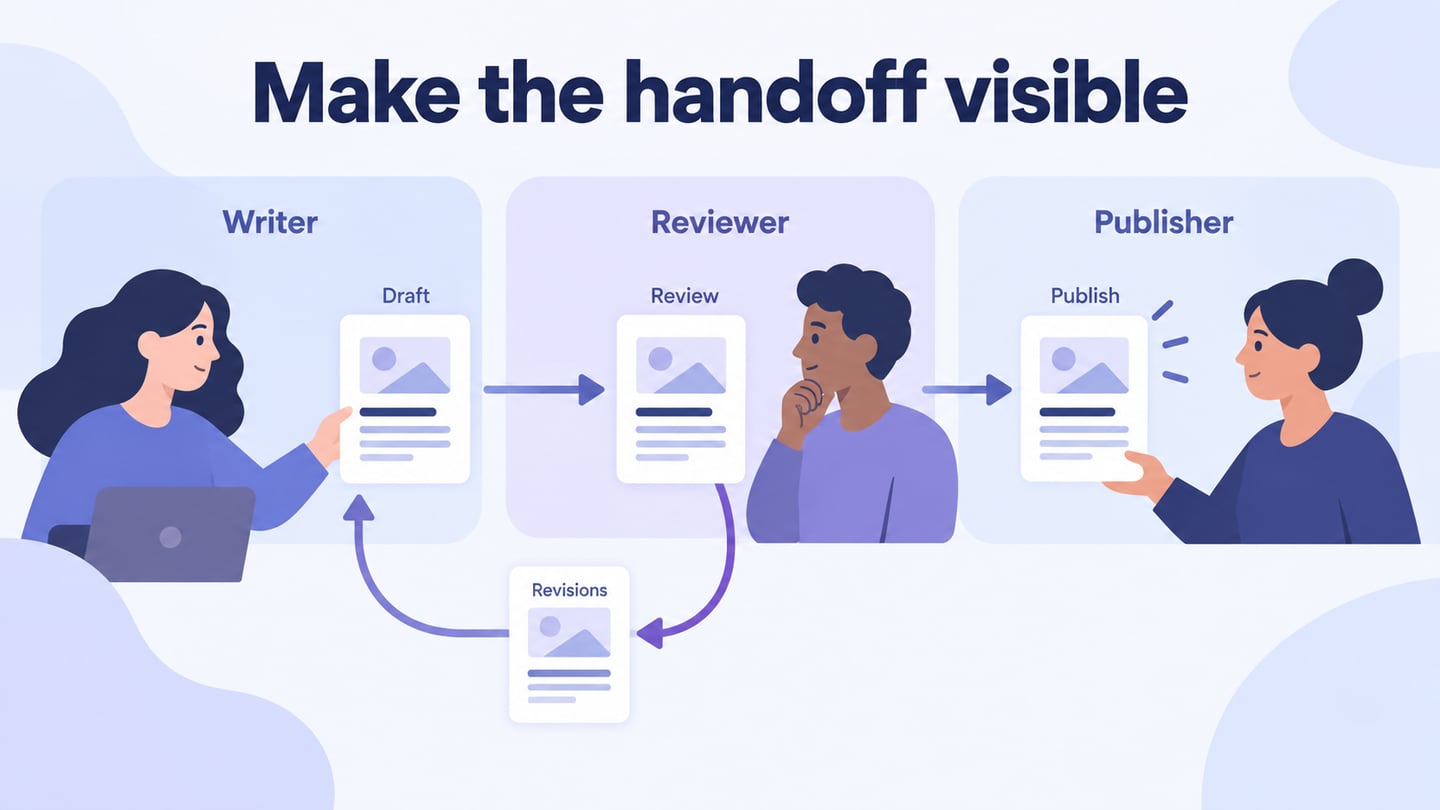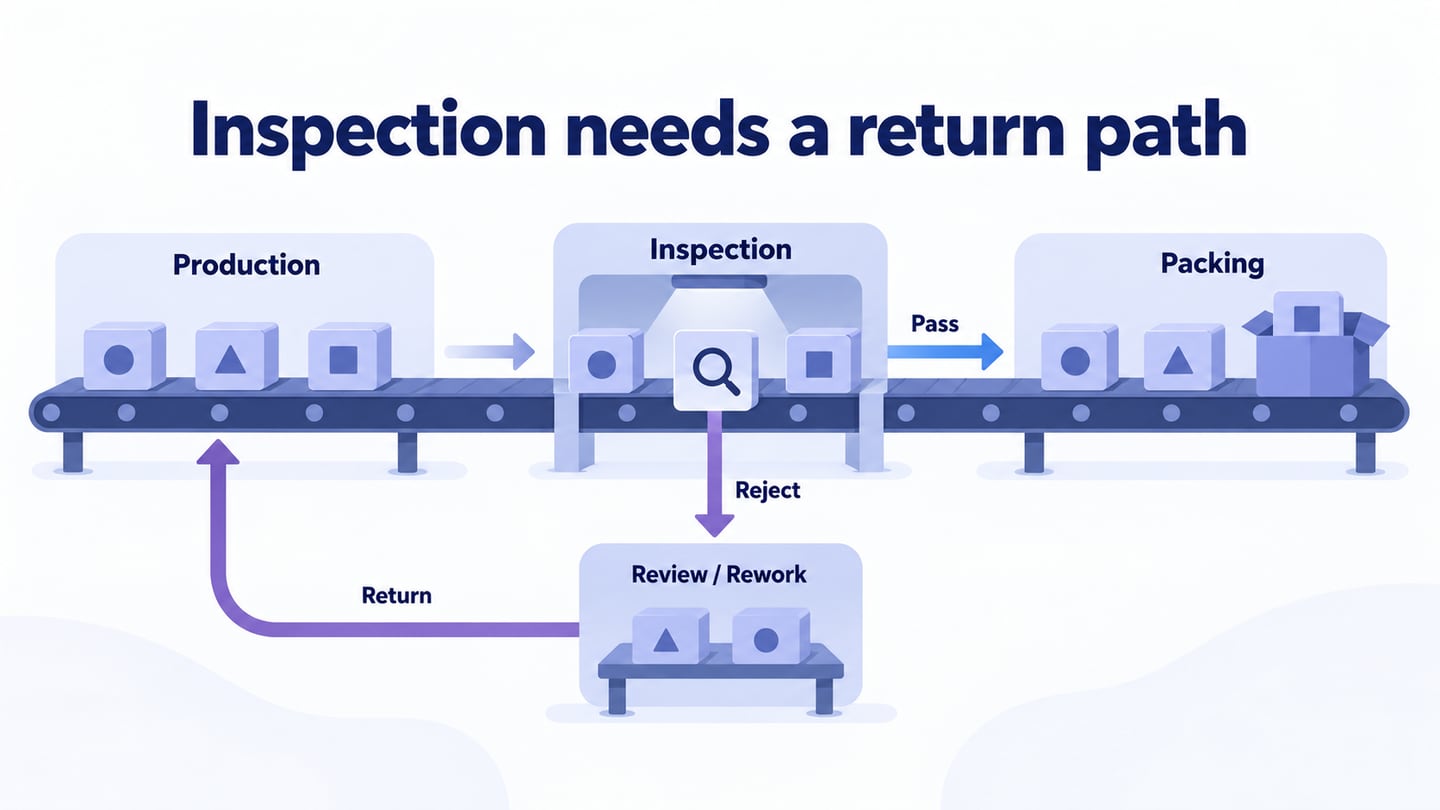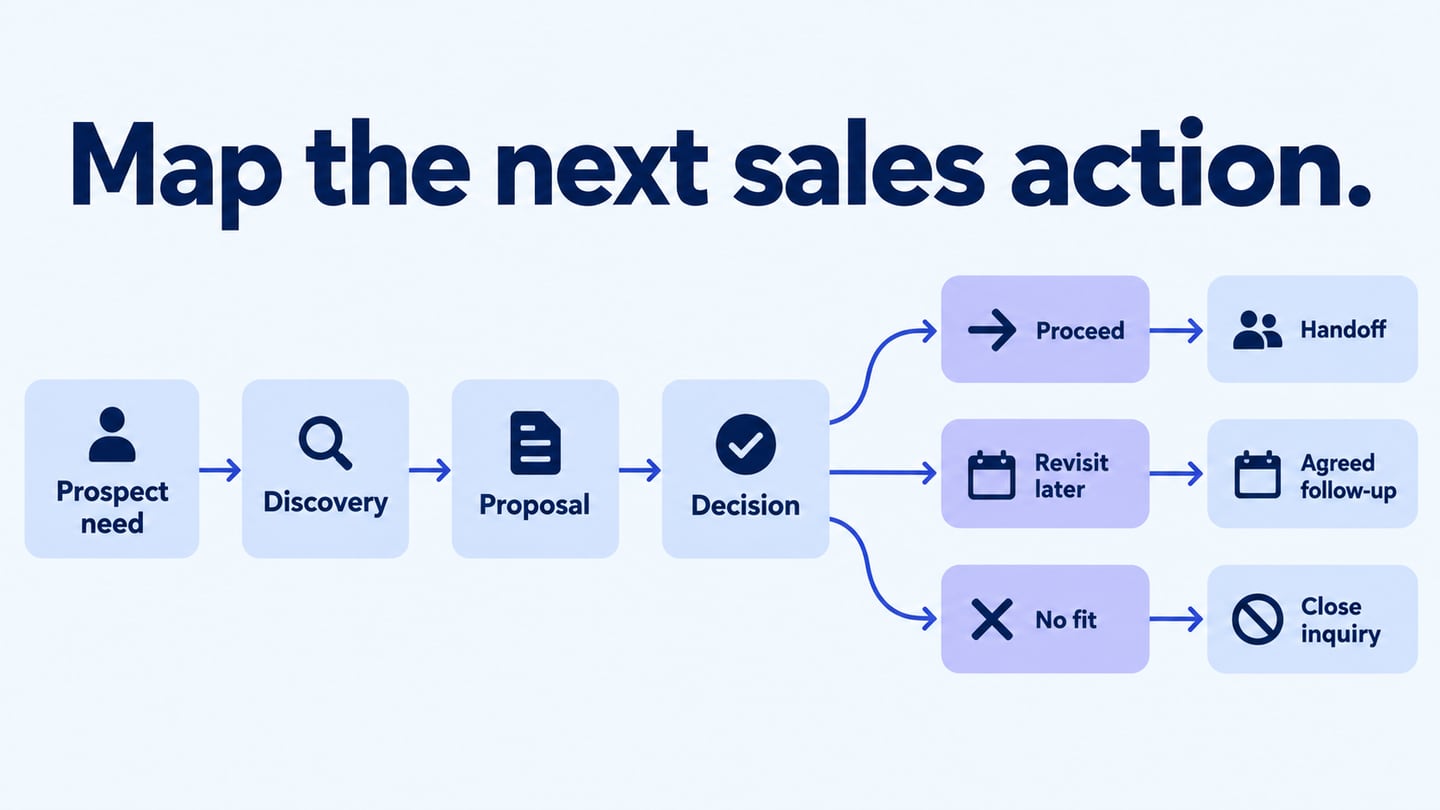
A process flowchart shows how a task moves from a defined start to an outcome through actions and decisions. Build one in a process flowchart editor when the team needs to understand the sequence, identify an unclear branch, or discuss a proposed change.
This guide explains the purpose of the diagram, how to gather the right information, and how to create and check a simple flow.
What is Process Flowchart?
A process flowchart represents a bounded sequence of work. The level of detail depends on the question: a high-level view can explain major stages, while a detailed view can show a specific decision or exception.
Flowcharts are used in business and technical work, but not every engineering diagram is a process flowchart. Specialized domains may require their own notation and expert review.
The diagram can make recurring steps easier to discuss and document. It does not guarantee that people will follow the process or that no step will be missed.
Useful outcomes of creating a flowchart include:
- Finding an unclear decision, duplicated action, or handoff that needs further investigation.
- Providing a shared reference for how the task is intended to proceed.
- Comparing the current process with a proposed revision while keeping their boundaries consistent.
Actual improvement depends on implementing and evaluating the change, not merely drawing the chart.
How to design a process flowchart?
Start with the question the diagram should answer. Avoid collecting information simply because it looks interesting; include the evidence needed to describe the process accurately.
Use these three preparation and drawing stages:
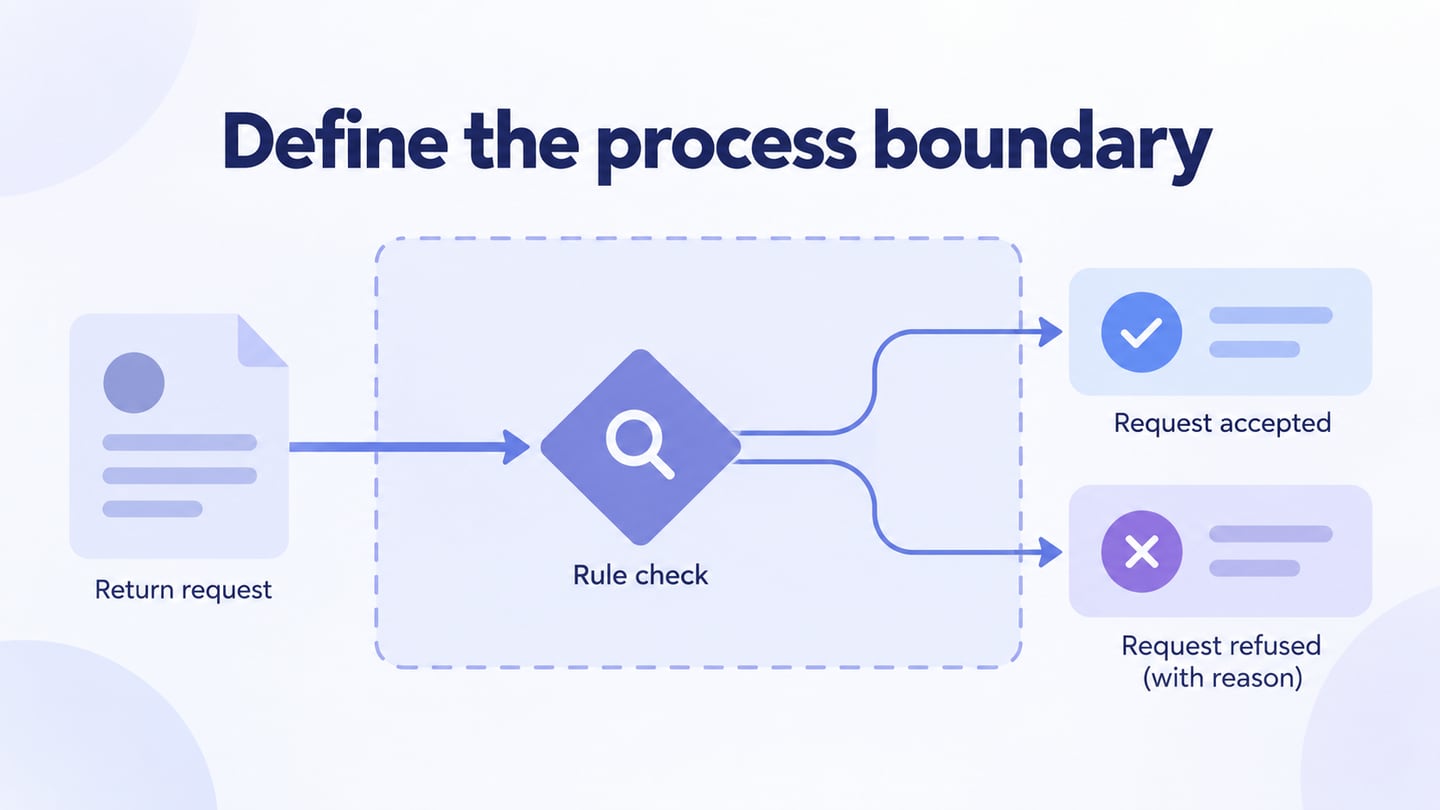
1. Define the process boundary: State what triggers the work and what counts as completion. Identify whose perspective the diagram represents.
For example, map how a returns request is reviewed. The start is a request received with order details. The team checks the applicable return rules, asks for missing information when necessary, and records either an accepted request or an explained refusal. The diagram ends at that decision; physical shipping and any later refund are outside this example’s scope.
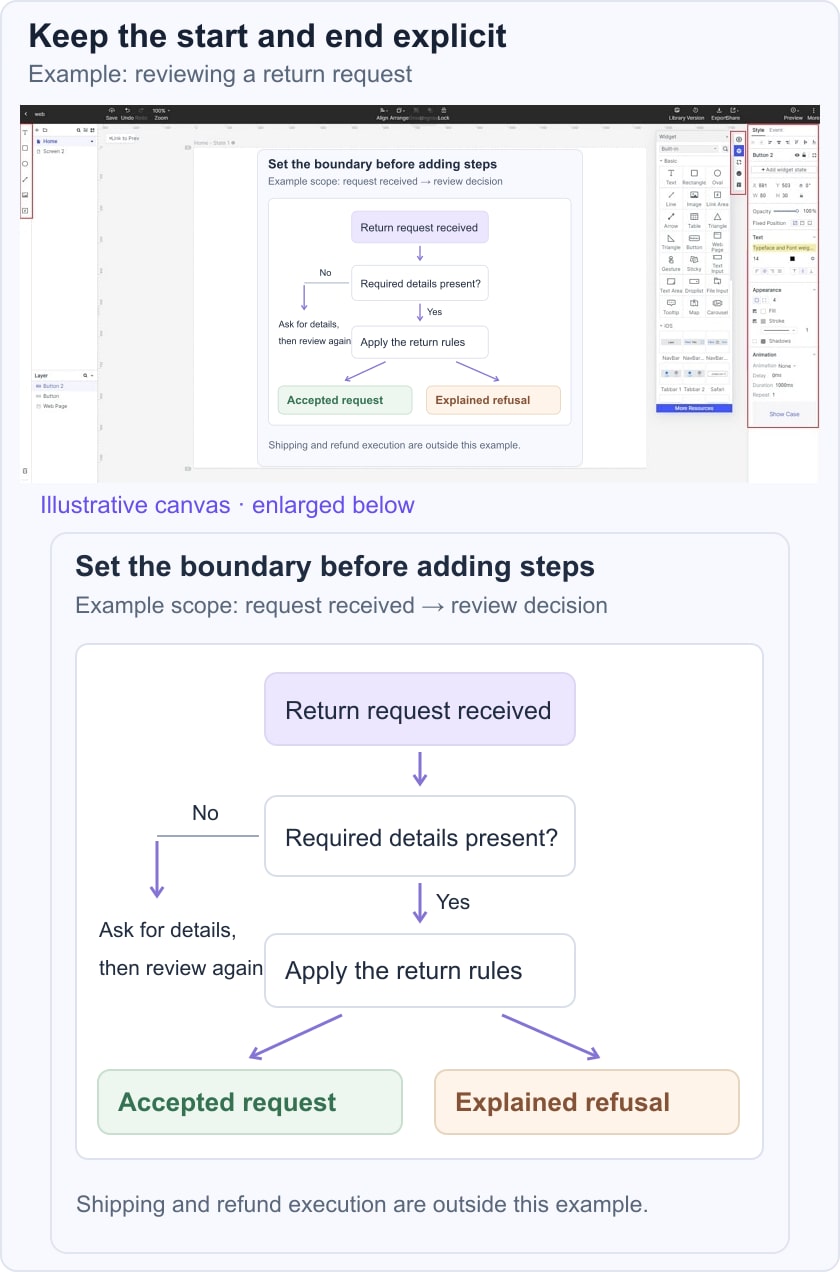
Choose the level of detail needed to review that task. A separate chart can describe shipping or payment processing if those processes need attention.
Write the scope next to the diagram so a reader does not assume that an accepted return request means a refund has already been completed.
2. Gather the real steps: Consult the people performing the task and inspect representative records. Identify required information, decisions, exceptions, and responsibilities.
Follow at least one normal case and one case with missing information. Ask where work waits and how it resumes. Public forums may suggest research questions, but they cannot establish the rules of your internal process.
Mark a rule as unresolved when the team has not agreed on it. Do not invent a return period or refund policy merely to finish the chart.
3. Draw and review the flow: Add a start marker, action rectangles, decision diamonds, labelled outcomes, and end states. Connect them in the order work occurs.
Keep labels specific, such as “Order details complete?” rather than “Check.” If details are missing, show the request for information and where the process resumes. For data movement instead of action sequence, use the data flow diagram guide.
Create a simple process flow chart
Mockitt provides an editable canvas for arranging and sharing the process. The retained product screenshot illustrates an earlier interface rather than a current menu-by-menu instruction.
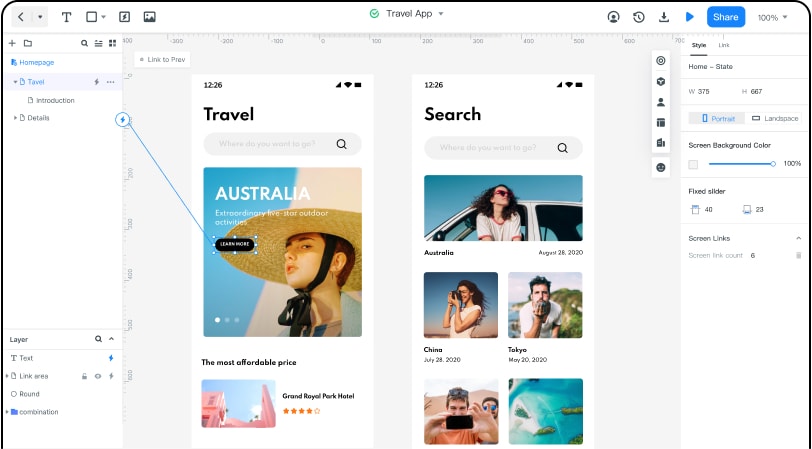
Create the chart in the current workspace and use the process notes as the source of truth:
1. Sign in and open a flowchart project or suitable diagramming canvas.
2. Add and name the elements, then connect the decision outcomes. Use a restrained style so the main path and exceptions remain visible.
3. Review the chart with the people responsible for the process. Trace a complete request, an incomplete request, and a refusal, checking that every route has a next action and a meaningful end.
Share the agreed version with a clear owner and purpose. When a policy changes, update the affected decision and repeat the walkthrough. If you start from an AI draft, the AI flowchart validation tutorial explains why the branches still need review.