Source
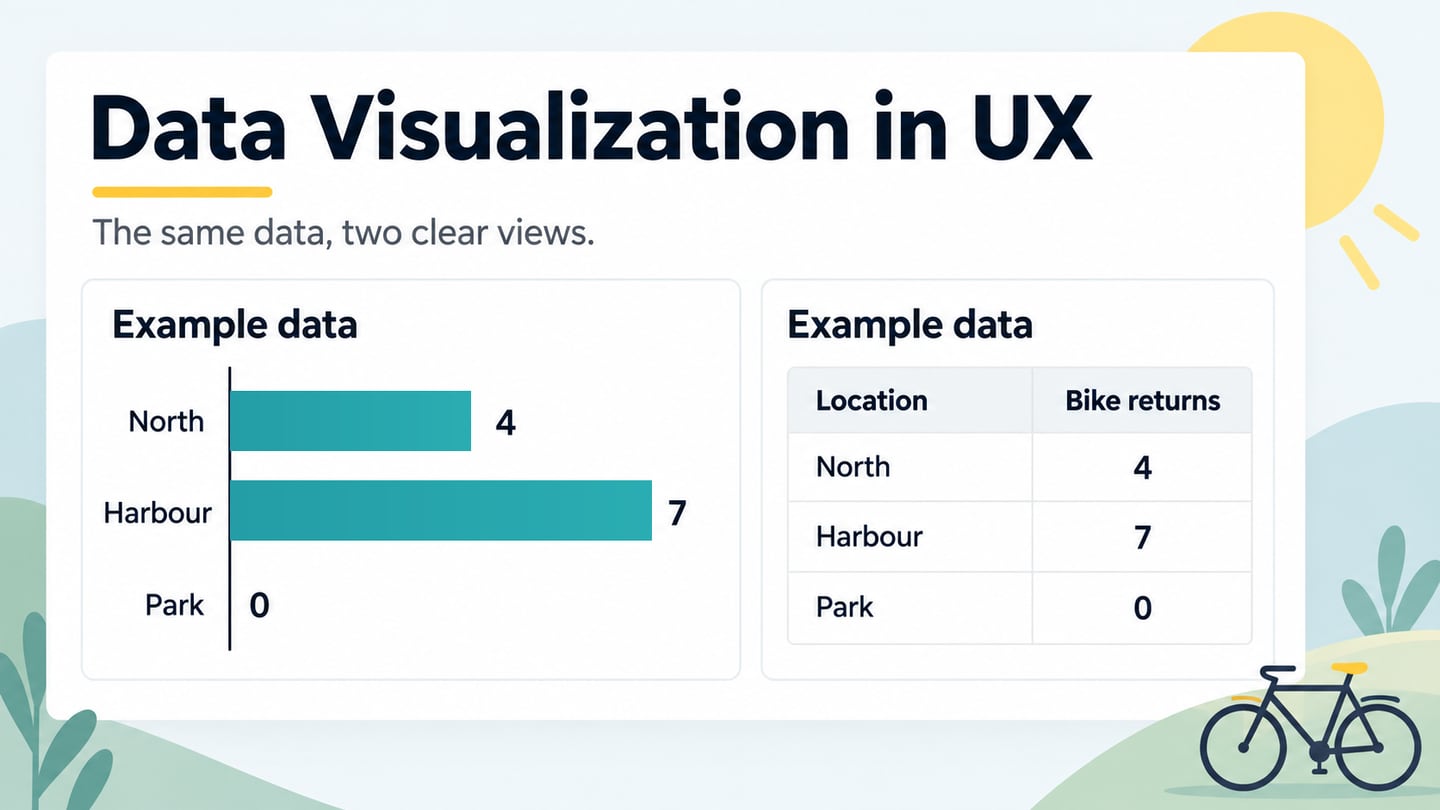
Information visualization uses visual representations to help people explore and understand information. It can reveal a hierarchy, show links between objects or represent similarities that are difficult to follow in a list. The goal is to support a particular task, not simply to display as much data as possible.
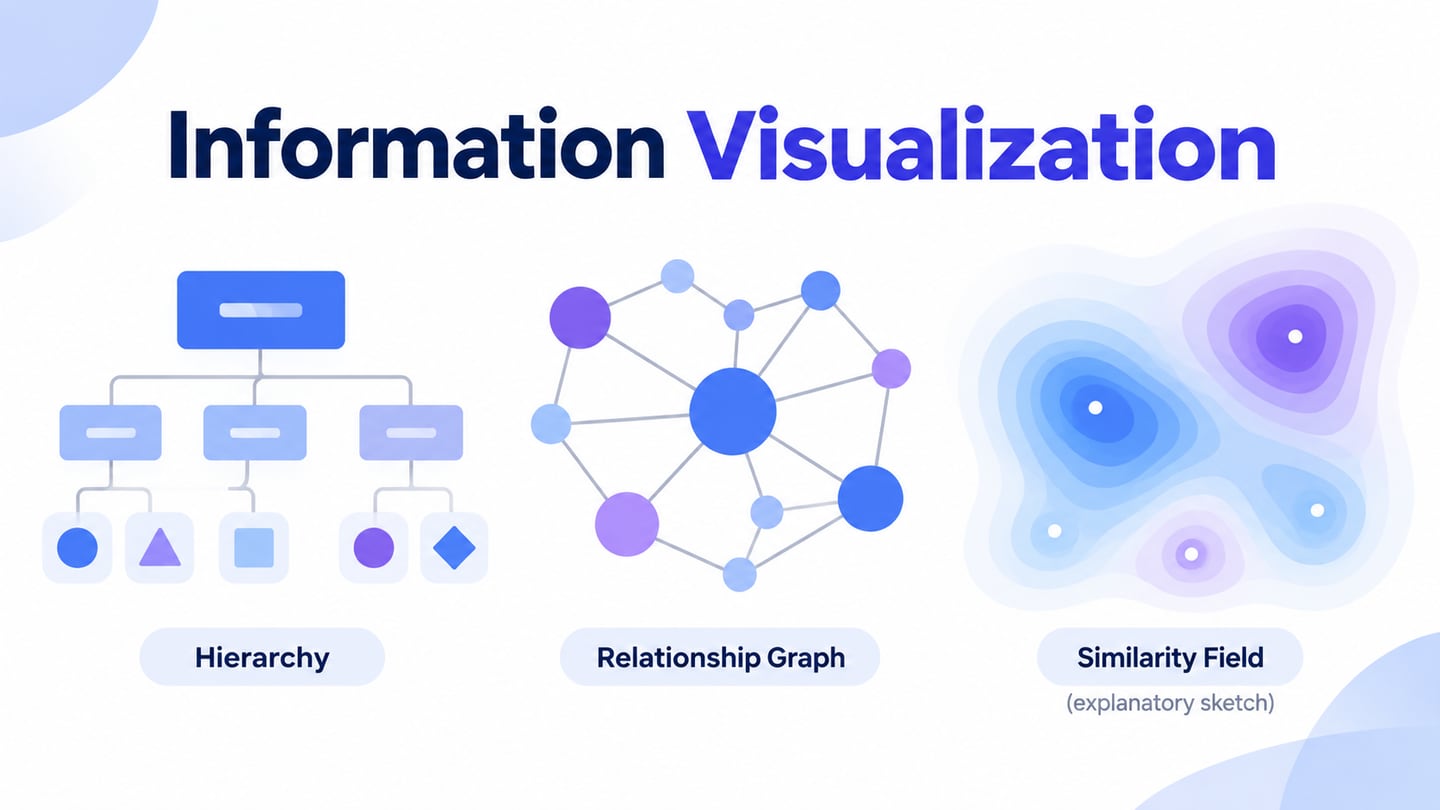
Familiar examples include bar charts and timelines, but information visualization also includes trees, networks and similarity maps. The structure of the information determines which view is useful. An interface design workspace can help you explore the presentation; it does not calculate the relationships or verify the underlying data for you.
Importance of Information Visualization
Information visualization can illustrate processes, workflows and relationships between objects. Classifying and structuring the information comes before drawing it: a hierarchy needs meaningful categories, while a network needs a clear definition of each connection. The resulting view may reveal a pattern worth investigating, but the visual pattern still needs interpretation and source context.
Viewing the same information from different perspectives can support analysis. A tree emphasizes parent–child relationships, while a network can reveal connections across categories. Neither is automatically the most understandable view. Check whether the representation helps the intended reader answer their question without requiring knowledge of unexplained conventions.
Well-chosen representations can make complex relationships easier to inspect. Comparisons still need consistent definitions, scales and context. The tasks of information visualization can be summarized as follows:
- Support researchers and users by representing process flows or object relationships
- Improve access to large information collections through meaningful grouping
- Support exploration while preserving links to the underlying information
- Make patterns visible for investigation, without treating appearance as proof
Common Applications of Information Visualization
Information visualization is used for several kinds of relationship. A tree can show hierarchical categories; a network can show hyperlinks between pages. The reader needs to know what a node and an edge mean. A link between two pages, for example, indicates a connection, not necessarily quality, authority or a causal relationship.
Libraries and document collections can use visual organization to make search results easier to explore. A topic hierarchy may help someone browse broadly, while related-item links support movement across categories. Marketing infographics can explain relationships too, but a visually attractive summary must still preserve the source and qualifications of the information.
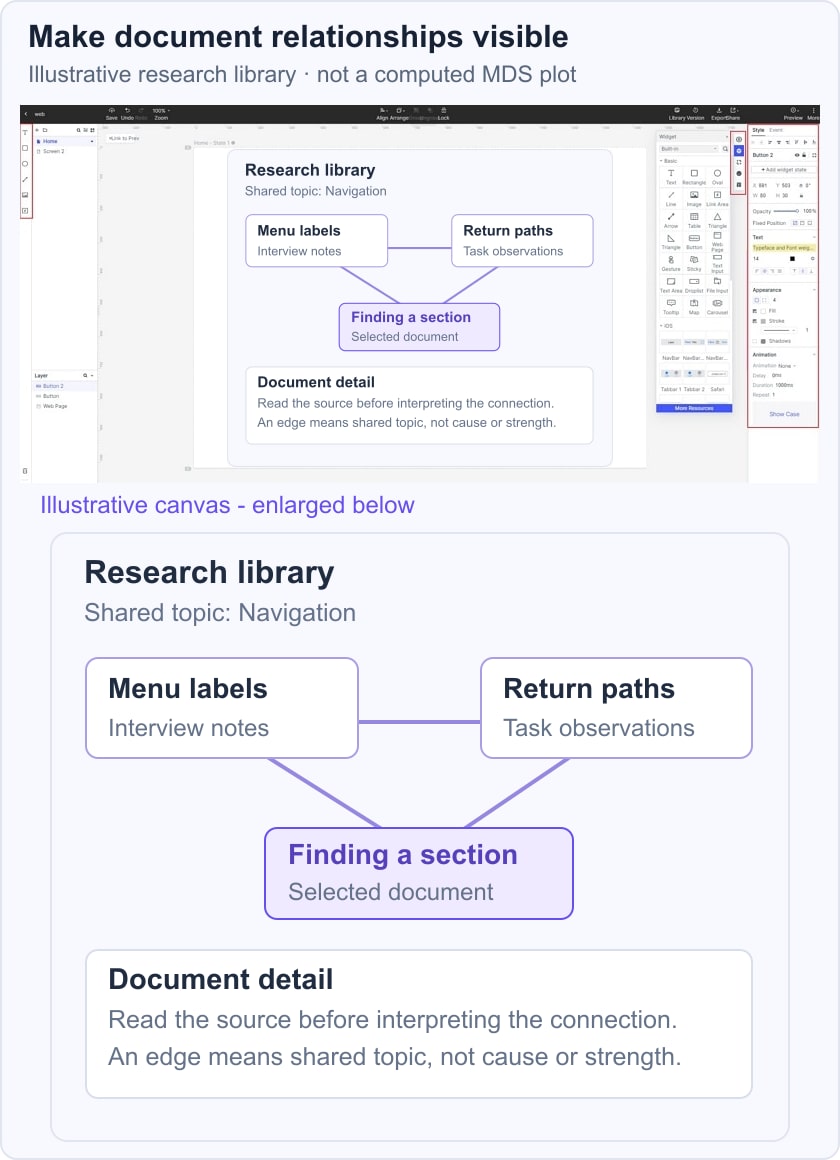
For an illustrative research library, place three documents under the topic Navigation and label a cross-link Shared topic. Selecting a document reveals its title and summary while the hierarchy remains visible. This screen shows a proposed browsing relationship, not a computed similarity score. Test whether a reader understands why the documents are connected before adding more edges.
Significance for usability
A visualization can fail when its preparation, labels or interaction are too complicated for the task. A dense network may be accurate yet difficult to read. Consider a searchable list or table alongside the visual view, make selection states clear and let readers inspect the source information. For complex diagrams, W3C guidance on complex images explains why the essential information may need a fuller text alternative than a short alt attribute.
Types of Information Visualization
Different techniques emphasize different structures. The following list includes visual forms, an analytical method and broader concepts; they are not interchangeable chart types:
- Cartogram: distorts geographic regions to represent a quantity.
- Cladogram: represents branching relationships in a classification.
- Concept mapping: shows concepts and explicitly labeled relationships.
- Hyperbolic tree: provides a focus-and-context view of a hierarchy.
- Multidimensional scaling: an analytical method that represents dissimilarities as distances.
- Parallel coordinates: uses parallel axes to compare several variables.
- Problem-solving environment: a broader workspace for analysis, not a single chart form.
- Treemapping: represents a hierarchy with nested rectangles.
- Dendrogram: shows a branching hierarchy, often from clustering.
- Information visualization reference model: describes a transformation process from data to visual representations.
- Graph drawing: represents nodes and connections in a network.
- Heatmap: encodes values with color within a defined arrangement.
What is multidimensional scaling?
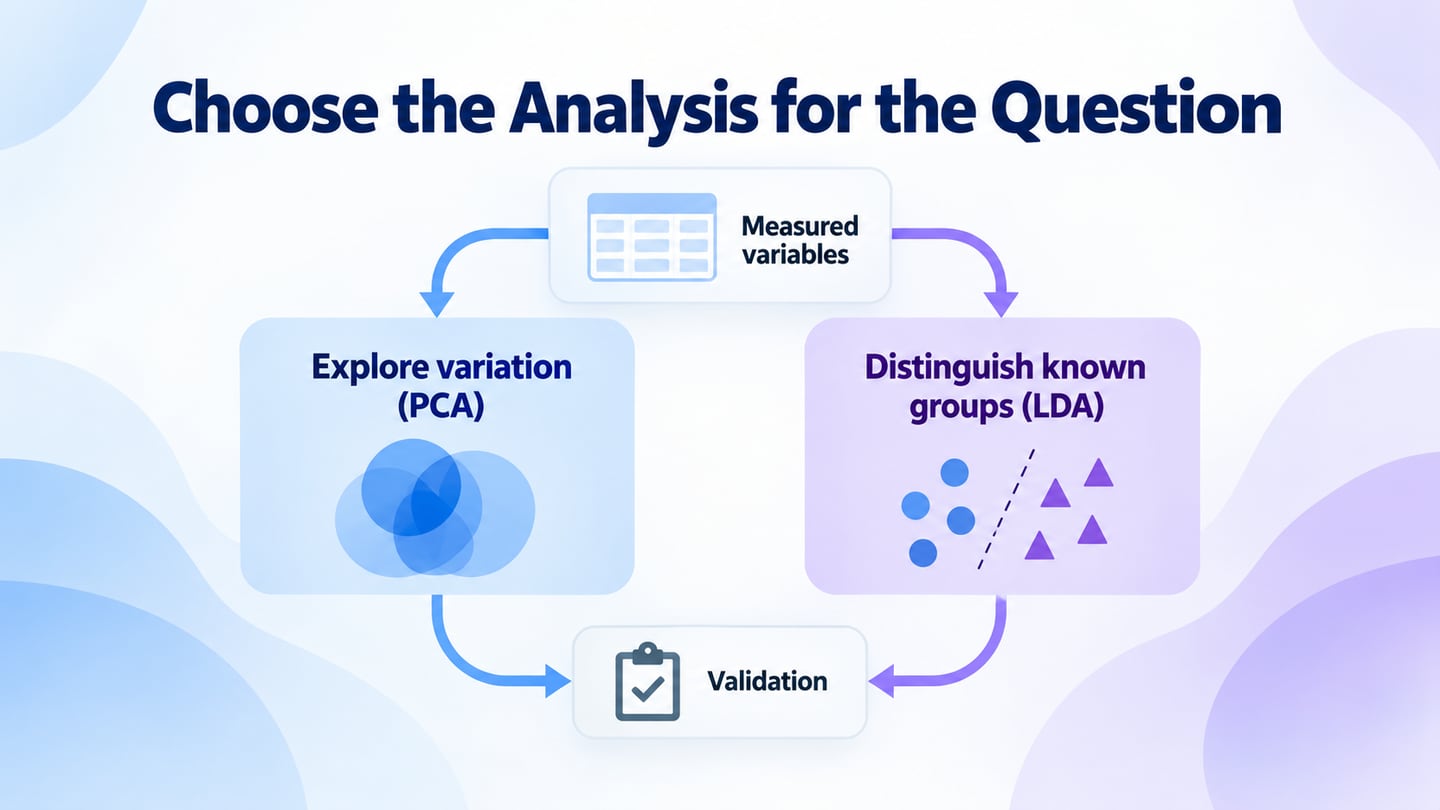
Multidimensional scaling, or MDS, seeks a lower-dimensional representation in which distances reflect dissimilarities between items. The scikit-learn MDS documentation explains the distinction between the input dissimilarities and the resulting embedding. Two dimensions are convenient for display, but the layout is an approximation whose fit needs evaluation.
Consider the original apple example: a researcher might collect judgments of how different pairs of apple varieties seem, or define distances from measured properties. The choice of properties and distance measure changes the meaning of the comparison. MDS is not multivariate testing, and a map cannot show that one property caused another.
A rating scale is one possible way to collect judgments, not a required five- or seven-point ingredient of MDS. The analysis begins with appropriately defined dissimilarities and seeks a configuration that represents them. Nearby points suggest relative similarity under those inputs; the axes do not automatically mean sweetness, color or quality unless that interpretation is justified.
There is no universal rule that MDS should use four to eight comparisons or four to twelve items. The study design, data quality and method determine what is appropriate. Inspect fit and uncertainty rather than reading every gap as an exact difference. Our apple example explains the idea only; it does not report collected ratings or a computed result. For broader evidence handling, see data analysis in research.
The Relationship Between Information Visualization and UX

Source
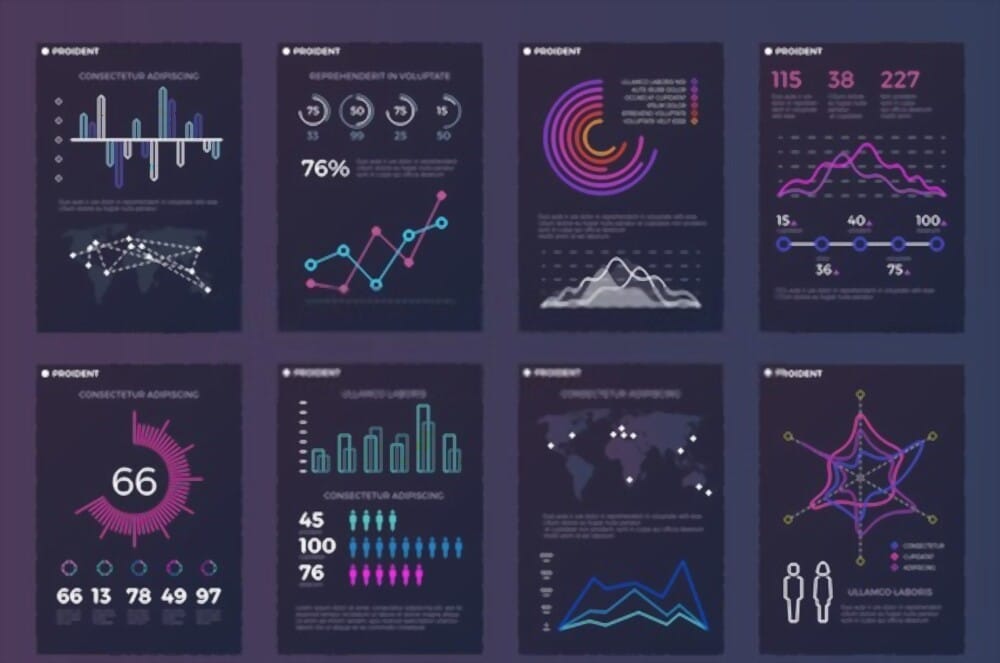
Information visualization can be part of a product interface or a way for a team to examine evidence. In either case, ask what the viewer needs to understand. The abstract image above is a decorative illustration of data, not a measured result or a demonstration of MDS.
Static and interactive views can each support understanding, but neither is inherently more useful than text. Information design addresses the broader organization and wording of a message; visualization adds decisions about how relationships are encoded and explored.
Why do UX Designers need information visualization?
UX designers may work with research notes, task outcomes, support requests and other sources. Their challenge is to make the scope and meaning of that material clear. Information visualization can support two distinct activities:
Information visualization to inform the design process: organize evidence in a research report or map so the team can inspect relationships and return to the source. Keep interpretations distinguishable from observations.
Information visualization in the product: help people explore a collection, inspect connections or understand a dashboard. Explain the grouping, labels and interaction so they do not have to guess what the view means.
Once the relationships are defined, prototype the presentation with clearly labeled example content. Review whether someone can find an item, understand its connections and recover their place. Validate the actual data processing and implemented interactions separately; a design composition demonstrates a proposal, not a working analysis engine.