Data visualization represents information through visual forms such as charts and maps. In UX, the goal is to help a person answer a question or make a decision accurately. A chart is useful when its encoding, labels and context fit that task. A UI design workspace can help explore the presentation before implementation; it does not replace data analysis or turn a static mockup into a live report.
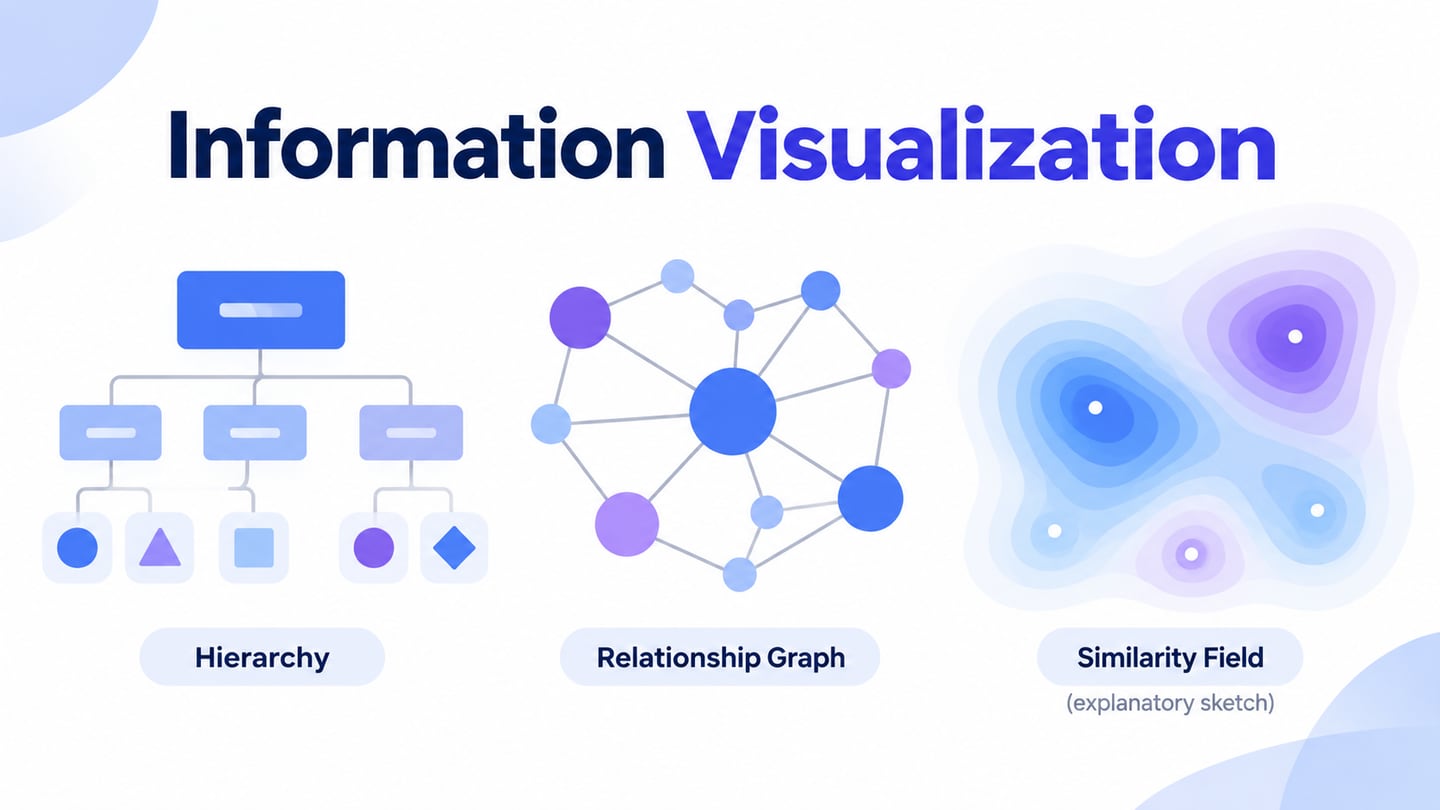
The six categories below describe different ways to represent information. Some are quantitative charts; others are conceptual or organizational diagrams:
1. Quantitative charts and tables: bar and line charts, histograms, dot plots and tables show numerical relationships in different ways. Choose the form according to the question. Comparing categories, following change over time and examining a distribution are different tasks.
2. Spatial or specialized representations: maps place information in geographic context, while polar or parallel-coordinate plots use other arrangements. The unfamiliarity of a form can add reading effort. Use it when the structure of the data and the task justify that effort.
3. Conceptual and planning diagrams: concept maps explain relationships among ideas, and Gantt charts represent scheduled activities over time. They can be useful visual communication, but not every diagram represents measured quantities.
4. Strategic and organizational views: performance summaries, lifecycle diagrams and organization charts communicate different aspects of a system. Distinguish measured indicators from a conceptual description so that a diagram is not mistaken for evidence of performance.
5. Metaphorical or schematic representations: trees and pyramids can show hierarchy, and transit maps simplify geographic detail to emphasize connections. Explain the convention being used. A schematic map should not imply that drawn distance is exact physical distance.
6. Combined views: a weather map can combine location, symbols and numerical information. Combining views can help answer a richer question, but each layer needs a clear purpose and legend. Do not make the reader decode several unrelated encodings at once.
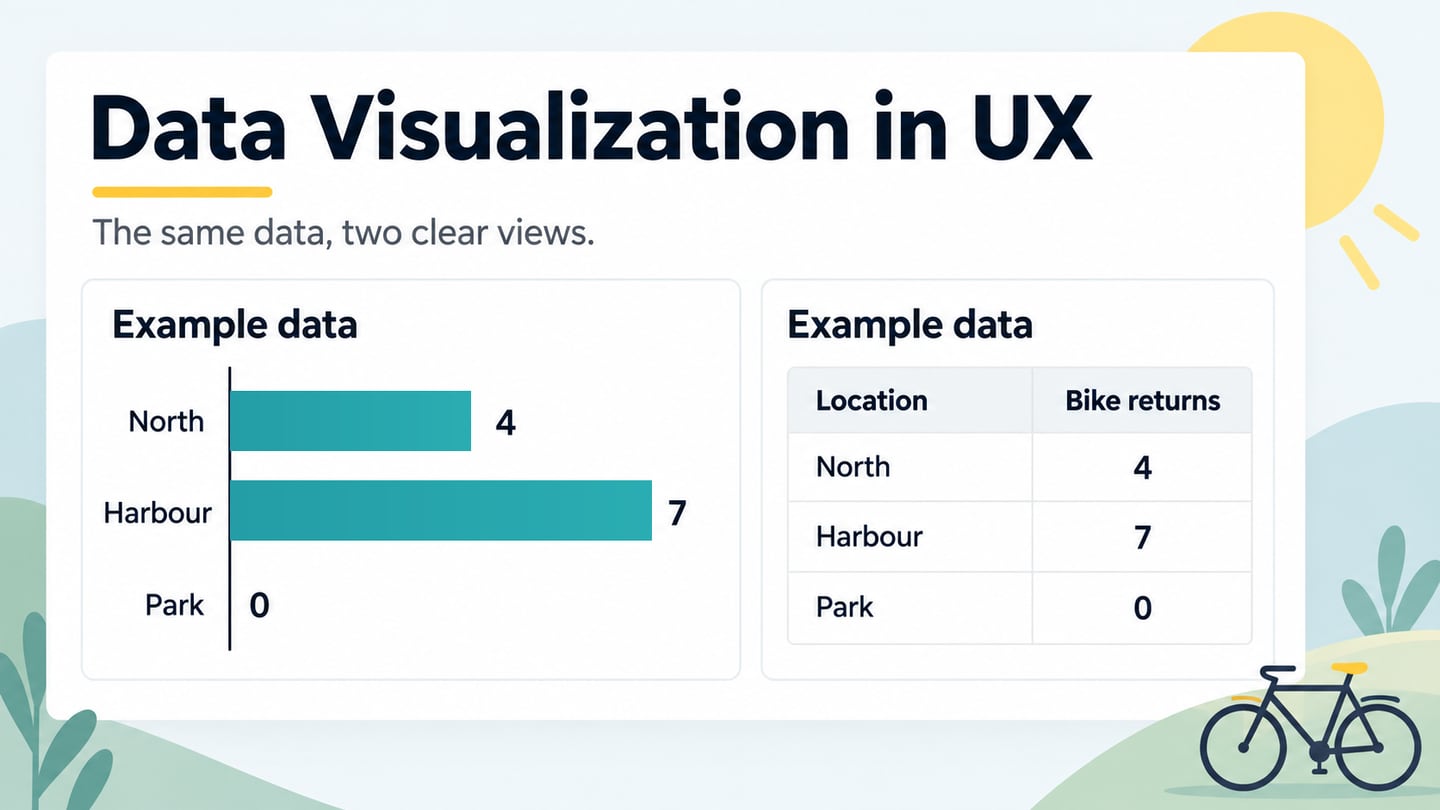
For a simple category comparison, consider fictional bike-hire returns: North 4, Harbour 7 and Park 0. Horizontal bars with a shared zero baseline show the comparison, while a matching table preserves exact values. Label the measure Returns and identify the numbers as example data. The zero at Park is an observed value within this invented example, not missing data.
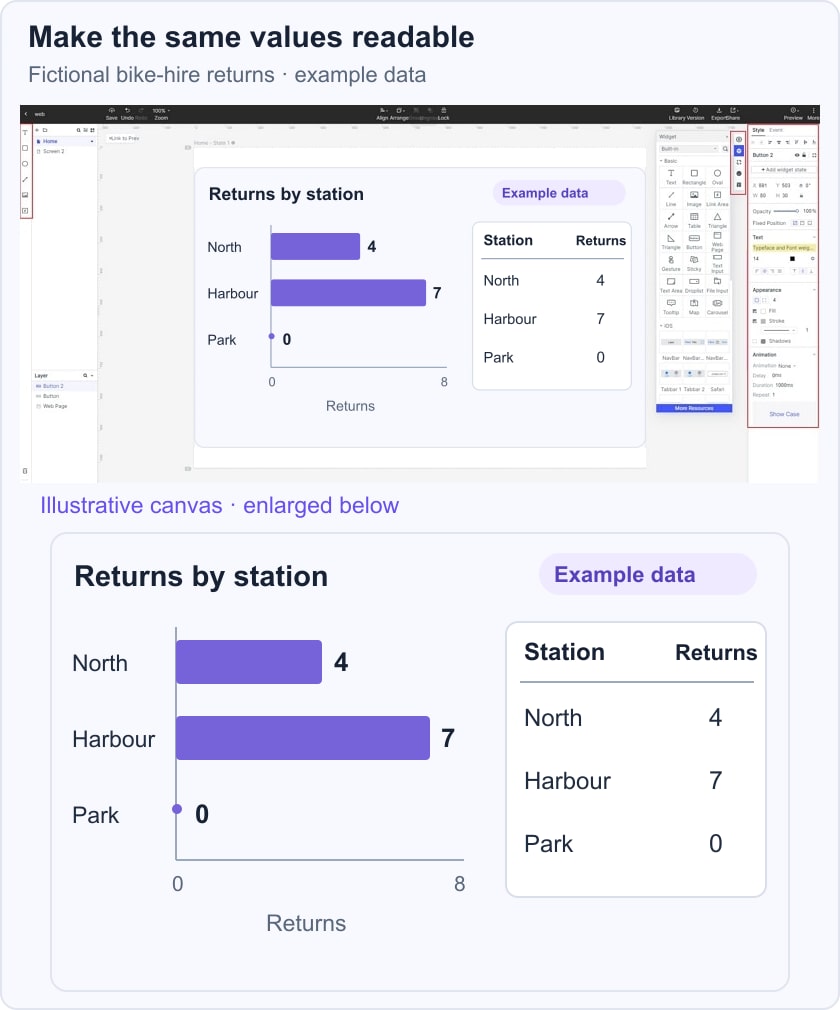
The UK Government Analysis Function chart guidance recommends clear labels, restrained formatting and accessible data alternatives. For this example, keep the station names and values visible and provide the same information in text. A static Mockitt composition can demonstrate the layout; it does not calculate or refresh the values.
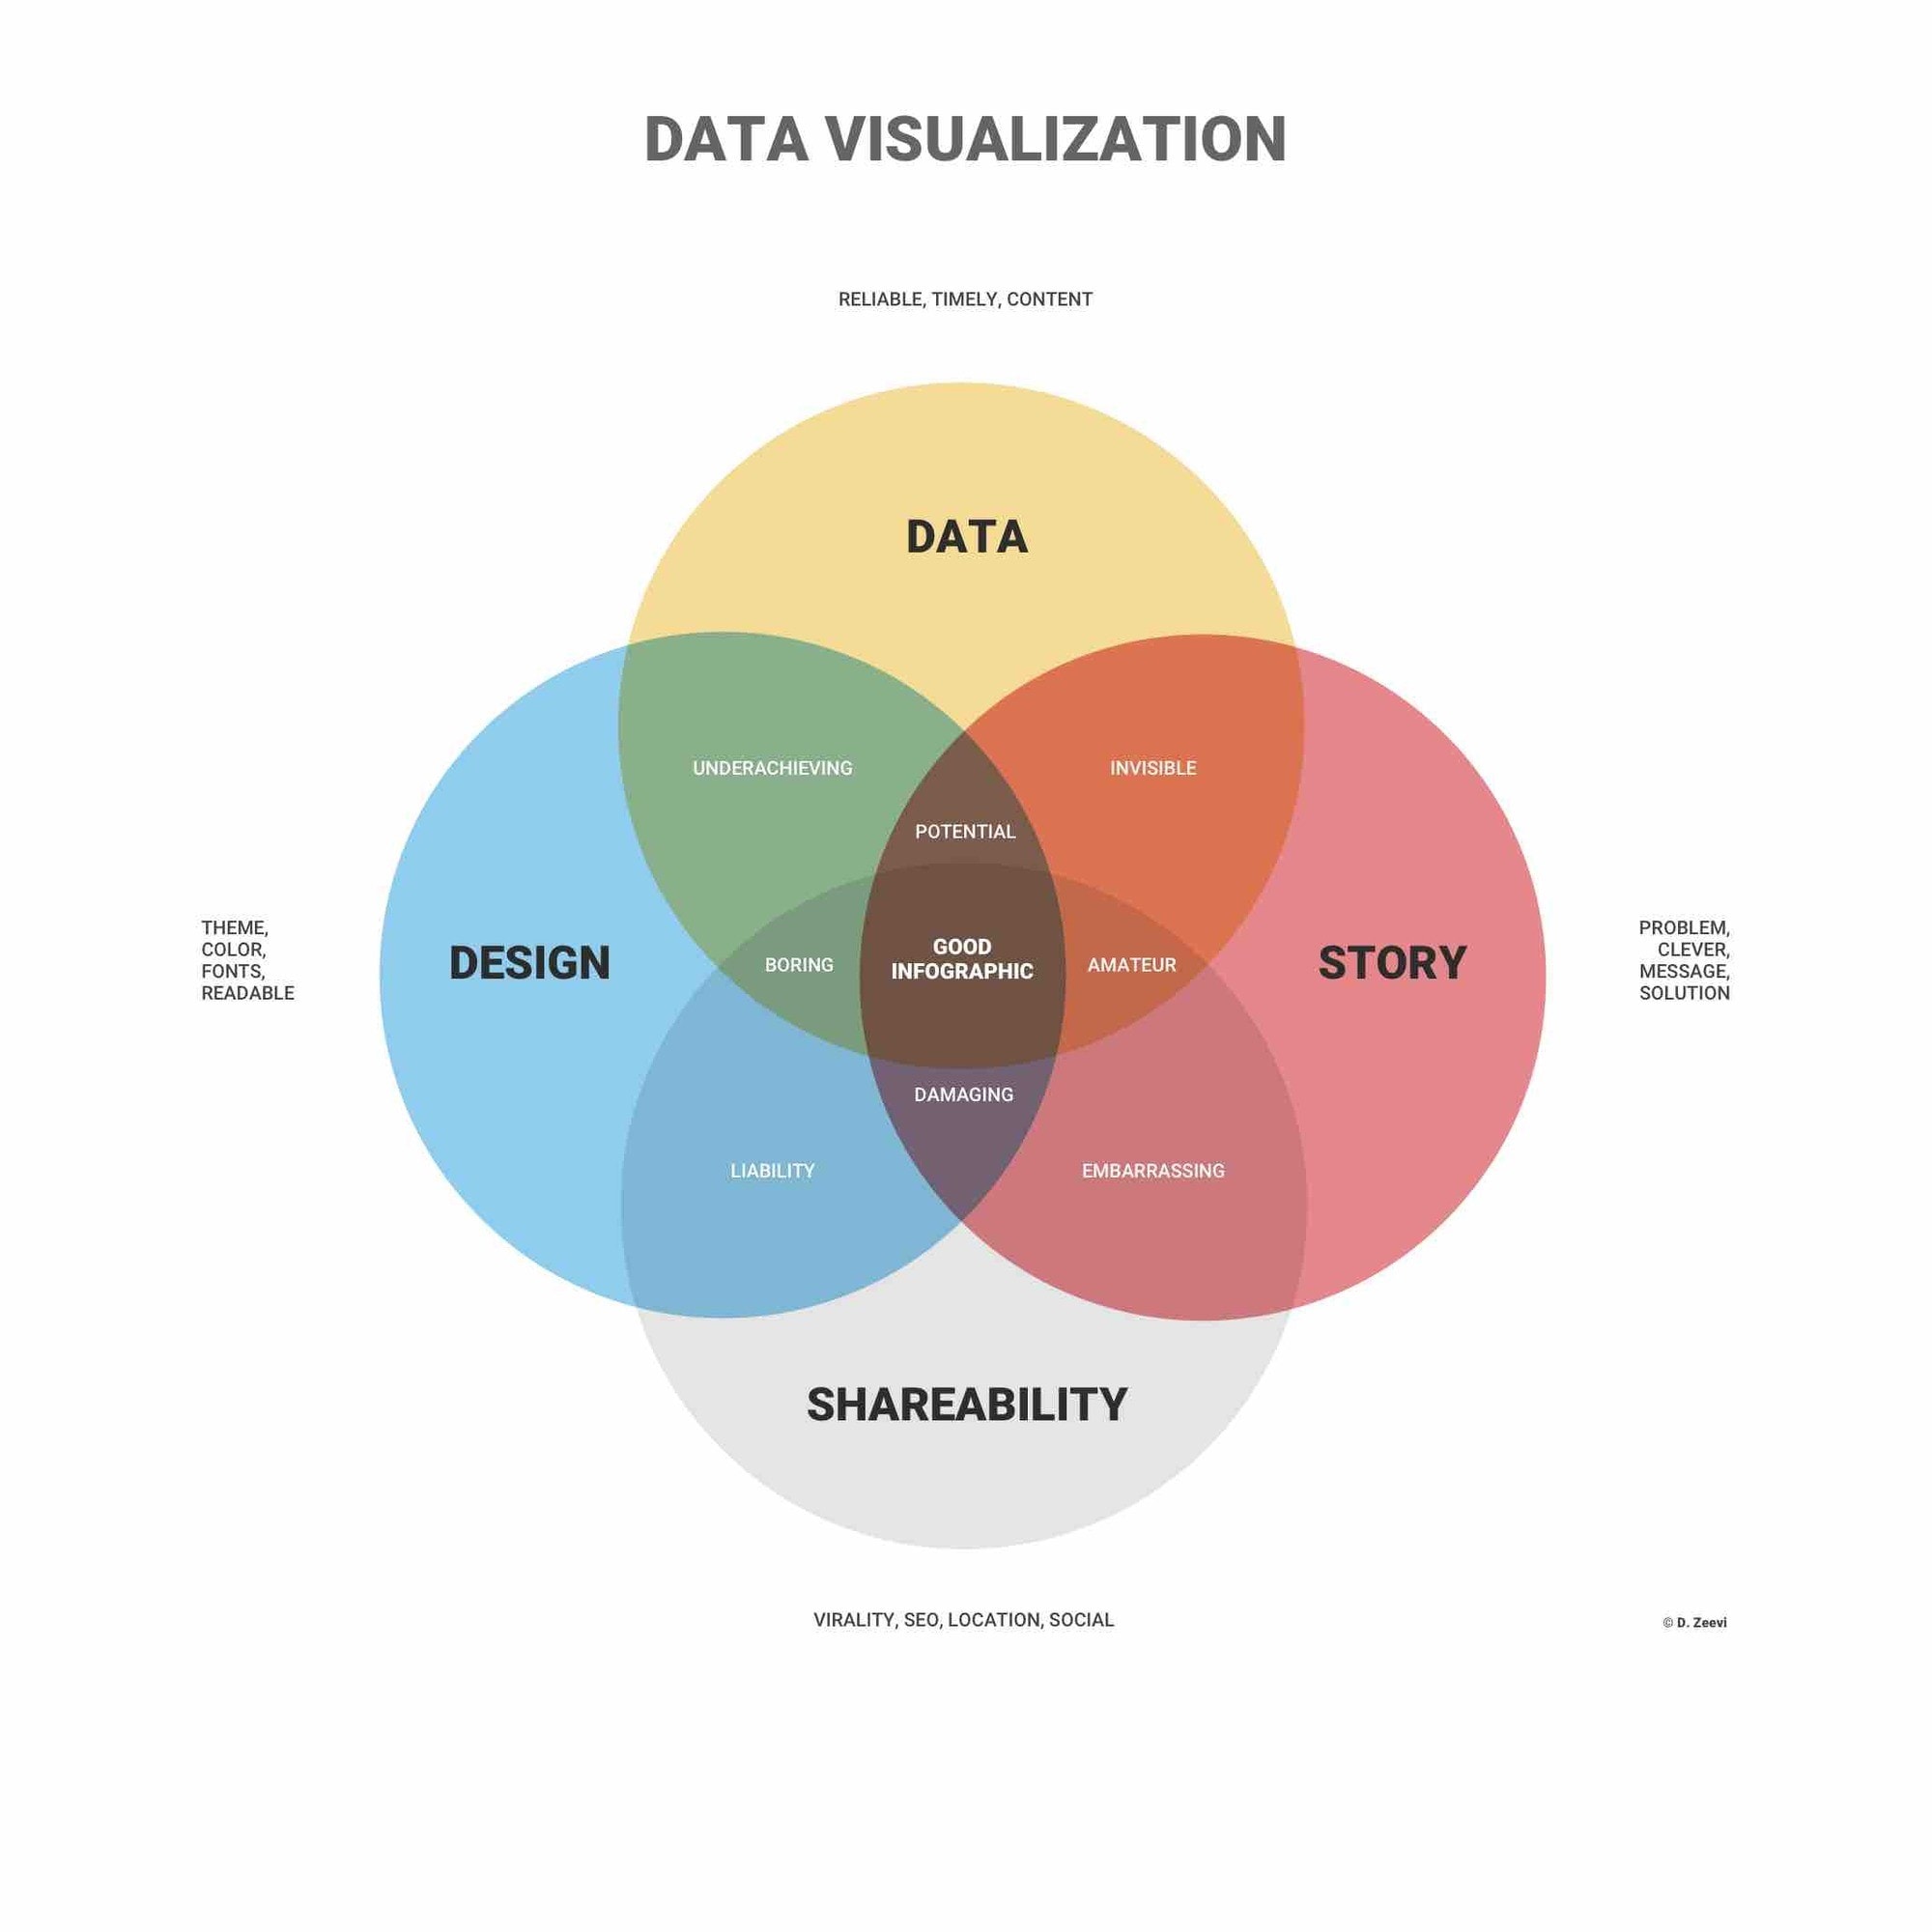 Conceptual infographic with original credit retained; not scientific evidence about information processing.
Original conceptual illustration connecting data, design, story and shareability; the visible D. Zeevi credit is retained.
Why visualize data?
A visual representation can make a pattern easier to inspect, but it does not guarantee understanding. The reader still needs meaningful labels, appropriate scales and context. Consider what they must compare or look up, then check whether the chart makes that task possible without unnecessary interpretation.
Help readers answer a question
A useful chart may make information more engaging, but increased traffic or loyalty is not an automatic outcome. Start with a question such as Which station received the most returns? Then choose a representation that lets the reader answer it without guessing what the colors, units or categories mean.
Easily Analyze Data
Charts can support exploration and reporting by making comparisons and unusual values visible. They do not perform every part of analysis. Check the underlying data, calculation and definitions before presenting a result; a polished graph can make an incorrect number look authoritative.
Explain relationships clearly
A chart may explain a relationship more directly than a long paragraph, while a table can be better for looking up exact values. Provide the form the task needs, and use a short explanation when the intended message could be missed. Do not assume that decorative complexity adds insight.
Other potential advantages
- Make a relevant comparison easier to inspect
- Support discussion of a decision with visible evidence and uncertainty
- Help readers explore a pattern at an appropriate level of detail
- Make information shareable while providing accessible alternatives
- Support analysts and subject experts rather than claim to replace their judgment
Common Uses for Data Visualization
Common areas of application for data visualization include:
1. Sales and marketing.
Sales and marketing teams may compare traffic sources, campaign activity or results over time. Make the reporting period and metric definition clear. A visual association between two measures does not by itself show that one caused the other.
2. Healthcare
Health reports may use maps to show variation between regions. A choropleth shades geographic areas according to a value, so the chosen measure, denominator and boundaries matter. State what the values represent and avoid presenting a general design example as medical guidance.
3. Finance
Financial displays may show prices, balances or changes over time. Candlestick charts encode opening, closing, high and low prices for a period. A chart presents information; it does not by itself determine an investment decision or predict a future result.
4. Science
Researchers use visualizations to explore and communicate observations. Include the units, sample or source context and uncertainty needed to interpret the figure. Distinguish measured data from a model output or an illustrative example.
5. Politics
Political reporting may show vote shares, seats or geographic patterns. Use the denominator appropriate to the question: a map of land area and a chart of vote share emphasize different things. Explain categories and avoid using a visual area to imply a quantity it does not represent.
6. Logistics
Logistics views can compare routes, locations and operational measures. A map can help a reader see a path, while a table may better support an exact lookup. The visualization should make assumptions and exceptions visible instead of claiming it automatically identifies the best route.
Five data-visualization tools and their roles
The five tools below serve different needs. Choose according to the data sources, audience, implementation skills and sharing requirements. Product capabilities and plans change, so confirm the current details with the provider. The original screenshots are historical illustrations, not a current feature comparison or a ranked recommendation.
1. Power BI
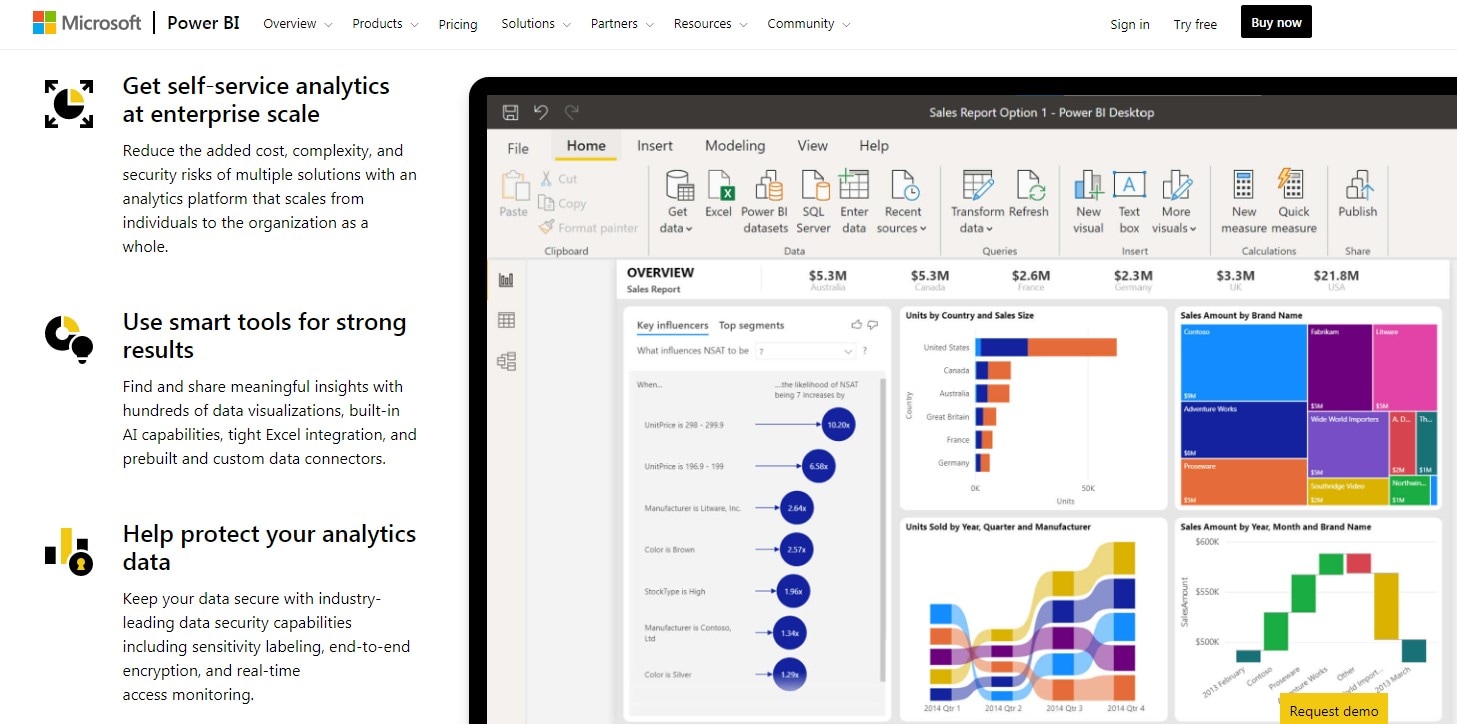 Historical Power BI capture; current capabilities and plans should be checked with Microsoft.
Microsoft Power BI supports connecting and preparing data, building models and creating reports. Desktop and service workflows have different roles in authoring and sharing. Check the data-refresh and access requirements for the intended deployment rather than assuming every report is automatically live.
2. ChartBlocks
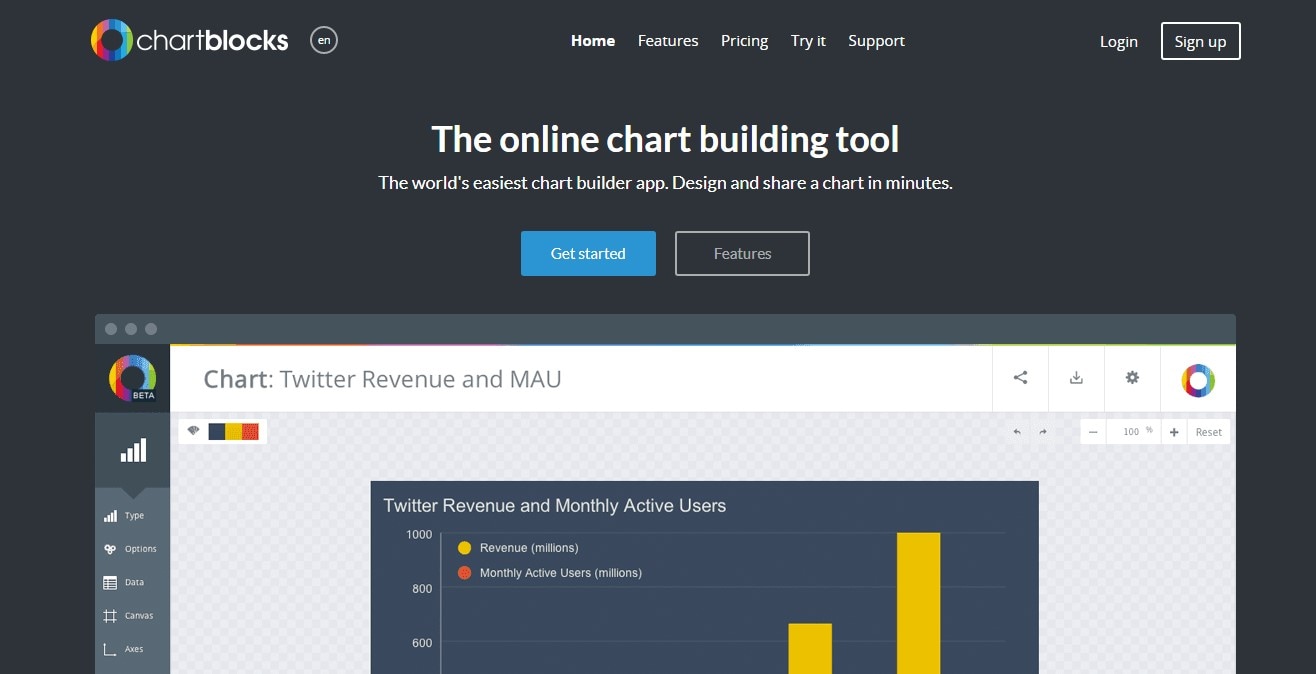 Historical ChartBlocks capture; the current official destination is chartblocks.io.
ChartBlocks is presented as an online chart builder at chartblocks.io. The historical screenshot below shows an earlier chart-building page. Confirm current import, export and sharing features before choosing it. Try a representative dataset and check the output you need instead of assuming that every source, file size or publishing destination is supported.
3. Zoho Analytics
 Logo identifying Zoho Analytics, not evidence of a tested workflow.
Zoho Analytics provides data integration, reports and dashboards. Evaluate the connectors, preparation work and access controls needed for your data. A product description does not establish that every upload or deployment meets your organization's requirements, and a logo does not demonstrate a particular workflow.
4. Plotly
 Historical Dash Enterprise page, not a Chart Studio screenshot.
Plotly provides graphing and data-application tools, including Dash-related products. Its official Chart Studio notice says Chart Studio closed on October 31, 2025, so that product should not be recommended as an available starting point. The retained screenshot shows an older Dash Enterprise page, not Chart Studio. Check the current product and documentation for the workflow you need.
5. Google Charts
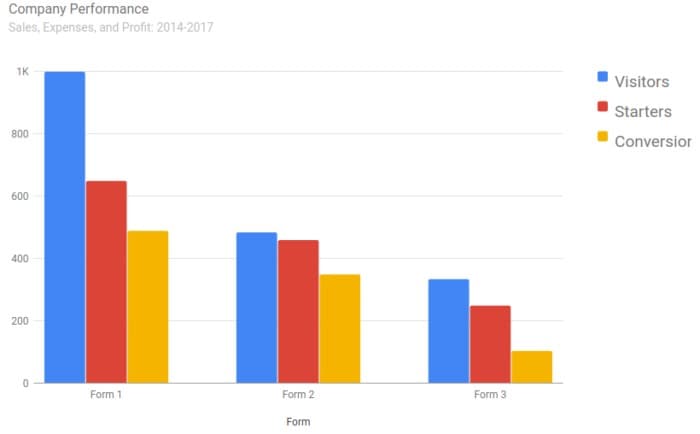 Illustrative legacy chart, not verified company data; its inconsistent title and series labels should not be treated as a model for labeling.
Illustrative chart retained from the original article; it is not verified company performance data.
Google Charts provides interactive charts for web use, with a chart gallery and configuration options. It is a developer-facing chart library, not a service that automatically validates or explains any uploaded dataset. The implementation must supply suitable data, labels, interaction behavior and accessible alternatives.
How data visualization relates to UX
Data visualization has two distinct roles in UX: it can help a team examine research or product evidence, and it can be part of the graphical interface people use. In both cases, the reader needs enough context to interpret the numbers and understand their limits.
In the design process, a team might summarize task outcomes or show a pattern in support requests. Keep the source, collection method and scope clear. An attractive report cannot make a small or biased dataset representative.
In a dashboard, a chart should support a user question: compare categories, inspect a trend or look up a value. Plan empty, missing-data and error states as carefully as the populated view. Zero and missing are different; a zero value should not disappear as though it had not been collected.
Use a prototype to review the hierarchy, labels and interaction concept with realistic example data. Mark fictional values as examples and avoid inserting private user information merely to make the screen look credible. Validate the underlying calculations and accessibility in the implemented product as well as reviewing the design.