Multivariate analysis examines several variables together to understand patterns or answer a research question. It does not generate a perfect solution merely by including more data. In a research analysis workflow, begin with the question, the measurements and the limits of the records. This guide explains why multiple-variable methods can be useful and how to distinguish principal component analysis (PCA) from discriminant analysis in an R workflow.
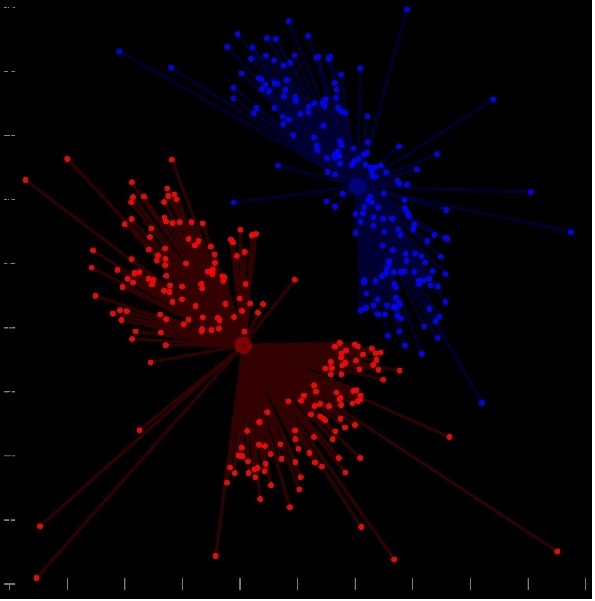
Original network illustration; it does not represent a reported analysis.
What is Multivariate Analysis?
Multivariate analysis is a family of statistical approaches for examining multiple measured variables. Some methods explore relationships among variables without a designated outcome; others use defined outcomes or groups. Choosing the method comes after deciding what the observations and measurements represent. Adding variables does not establish a causal explanation, and a larger dataset does not automatically remove bias or measurement error.
Suppose a firm experiences declining sales. Price, product availability, customer needs and competitors may all be relevant, but listing them is only a starting hypothesis. Collect suitable records, define the period and units, and consider which factors were actually measured. An association in those records may suggest further investigation; it does not show that changing one factor will reverse the decline.

Abstract illustration of connected information, not an analysis-of-variance result.
Why is Multivariate Analysis useful?
Multiple-variable methods can help researchers examine patterns that would be hard to follow one variable at a time. For example, task time, error count and a confidence rating capture different aspects of a research task. Their relationship may be informative, but each measure needs a clear definition and an appropriate sample. Missing values and inconsistent recording can affect the result.
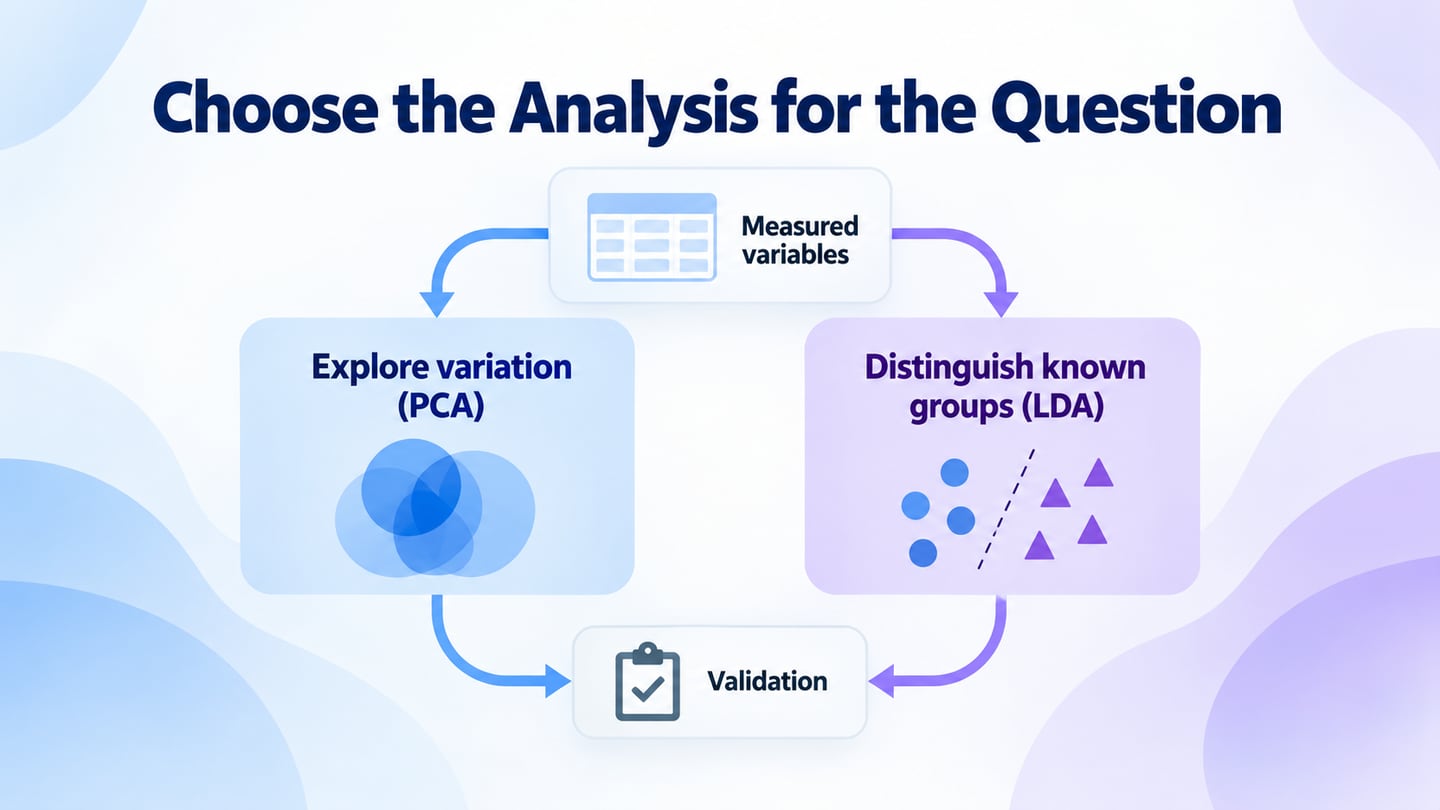
Different methods answer different questions. PCA explores variation in numerical measurements; clustering groups observations under a chosen similarity definition; discriminant analysis uses known groups. Multiple regression and conjoint analysis address other questions and are not interchangeable procedures. Within a UX design process, select an analysis for the evidence required rather than because it sounds more advanced.
For UX work, an analysis might reveal a pattern worth examining in a design or further study. Keep that finding separate from the proposed interface change. A statistical relationship cannot by itself tell you which button label to use or show that a new layout will improve task completion. Review the measurement context and competing explanations before deciding what to prototype.
Multivariate analysis is not automatically better than a univariate summary or a two-variable comparison. A straightforward count or distribution may answer the question more clearly. Use additional complexity only when the question and data justify it, and report assumptions and uncertainty alongside the result.

Decorative chart illustration; no business performance result is claimed.
How to do Multivariate Analysis?
The following four stages preserve the practical progression from data preparation to interpretation. PCA and discriminant analysis are different choices within that work, not two mandatory commands to run in sequence. The retained screenshots show separate historical examples; they do not form one reproducible dataset or demonstrate a UX study.
Step 1: Prepare the data and question. Put observations in rows and variables in columns, with names and units documented. Preserve the raw records and record any cleaning decisions. Distinguish missing values from meaningful zeros. Decide whether you want to explore variation or classify observations into groups known in advance. The spreadsheet image below contains car measurements, not participant-task data.
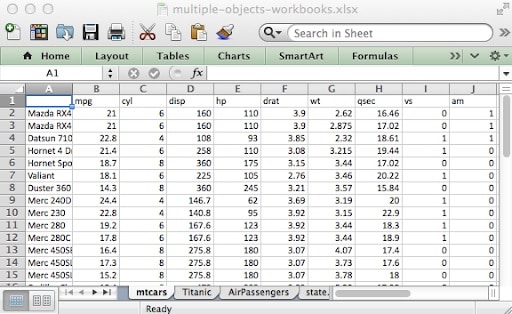
Historical spreadsheet showing the mtcars data; this is a separate example from the following screenshots.
Step 2: Inspect the imported data in R. Check variable types, ranges, missing values and identifiers after importing. RStudio is an interface for working with R, not a guarantee that data were imported correctly. Inspect summaries and plots before selecting a method. The historical RStudio image below shows household and age/income fields, so do not treat it as the same analysis as the car spreadsheet.
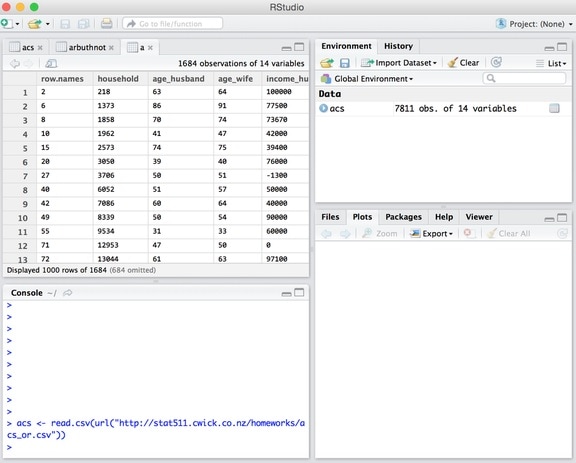
Historical RStudio data view with household and income-related fields.
Step 3: Choose an analysis for the question. Alternative A: PCA. PCA constructs components from numerical variables to summarize variation. It does not require known class labels or select the “best” observations. The R documentation for prcomp describes centering and scaling options. Scale choices matter when variables use different units; inspect the data rather than applying a setting mechanically.
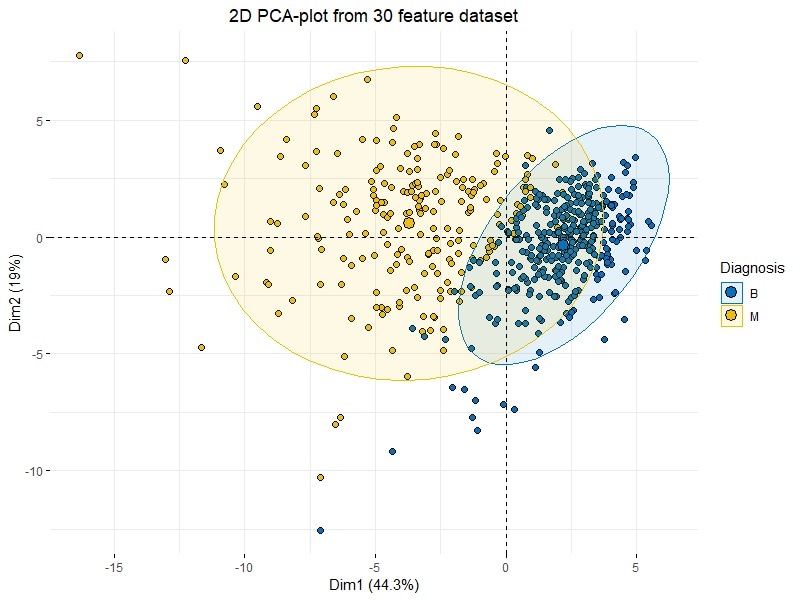
Historical PCA plot with B/M diagnosis labels. It is not a UX result, medical conclusion or output from the preceding example data.
Alternative B: Discriminant analysis for known groups. Linear discriminant analysis (LDA), one form of discriminant analysis, uses a specified grouping variable and predictors. This is an alternative to the PCA question above, not the next required command. The MASS lda documentation describes its inputs and cross-validation option. Check whether its assumptions and the representation of each group suit your records.
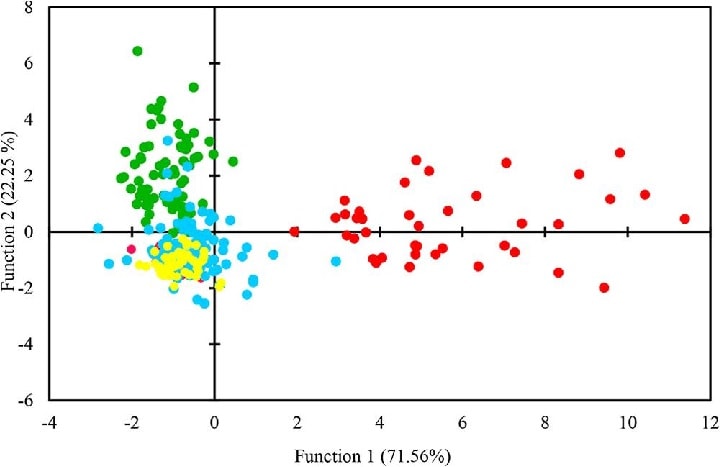
Historical discriminant-function plot; the original dataset and predictive accuracy are not established here.
Step 4: Validate and interpret the selected analysis. Check the chosen method’s assumptions and how preparation choices affect the result. For prediction, evaluate performance on data not used to fit the model; a separated plot is not sufficient. The University of British Columbia multivariate guide distinguishes PCA from LDA and illustrates validation. Report what the analysis supports, what remains uncertain and how it answers the original question.
Software for UX
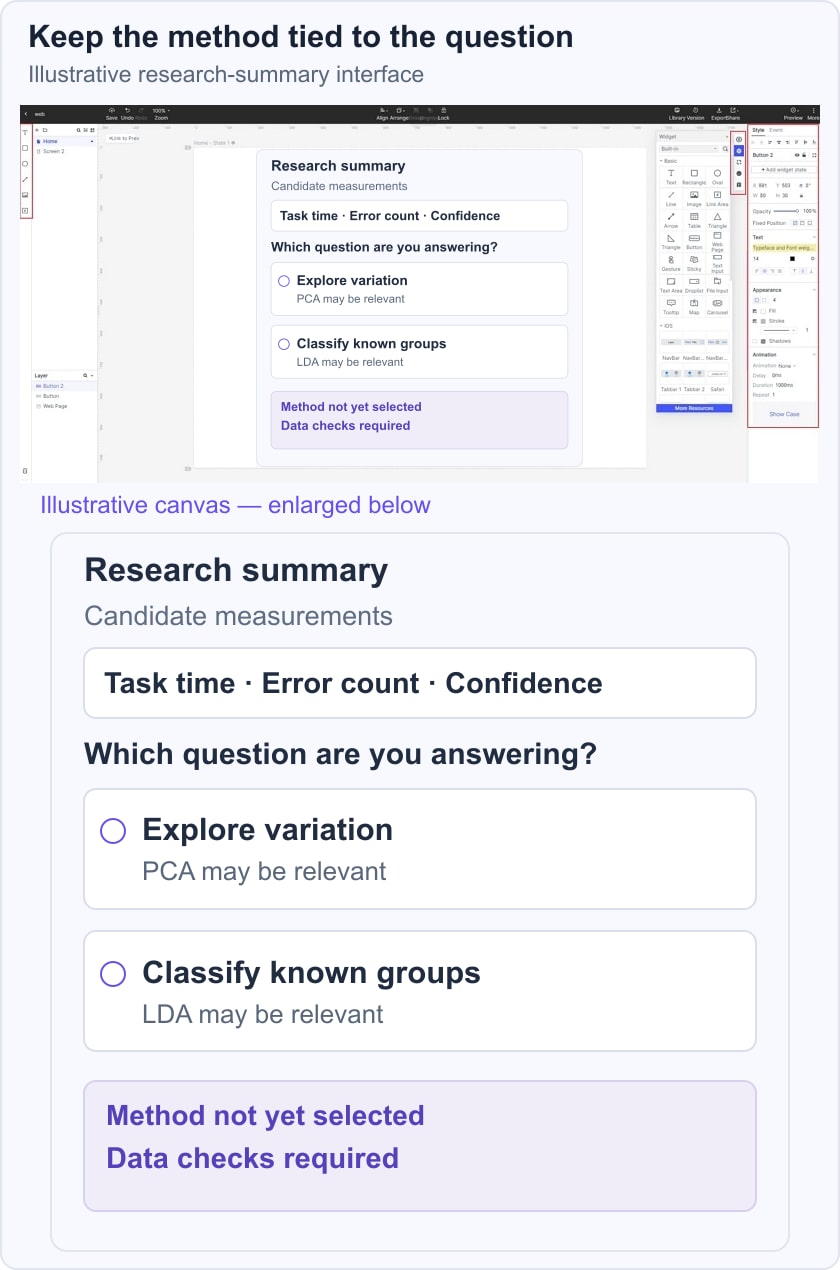
Mockitt provides a workspace for a proposed interface response once the analysis identifies a design question. Keep calculations and research records in appropriate statistical tools. Use the prototype to show the relevant content, controls and states, then evaluate whether people understand them. It does not run PCA, establish causal relationships or turn an analysis into a working production website.

Using Mockitt to communicate a design proposal
- The Asset Library comprises built-in elements to include in your web design effortlessly.
- You can customize the elements like widgets and icons and save them in the Asset Library for future use in other projects.
- Drag and drop interface elements to explore a layout; complex behavior still needs deliberate design and implementation.
- Share the draft using the access controls available to your account, and state the question reviewers should consider.
- Creating a visual draft does not require implementing the whole application, but accurate labels, realistic states and testing still require care.
For an illustrative research-summary interface, show task time, error count and confidence as candidate measurements. Offer two clearly described questions: “Explore variation” and “Classify known groups.” Keep “Method not yet selected” and “Data checks required” visible until the evidence supports a choice. This is a design example, not a calculated model or research finding.
Conclusion
Multivariate analysis can help examine relationships across several measurements, provided the question, data and method fit. Preserve the path from raw records through preparation, analysis and interpretation. Treat proposed design changes as hypotheses to evaluate, not as guaranteed consequences of a statistical pattern. A useful prototype explains the intended response and the question it still needs to answer.