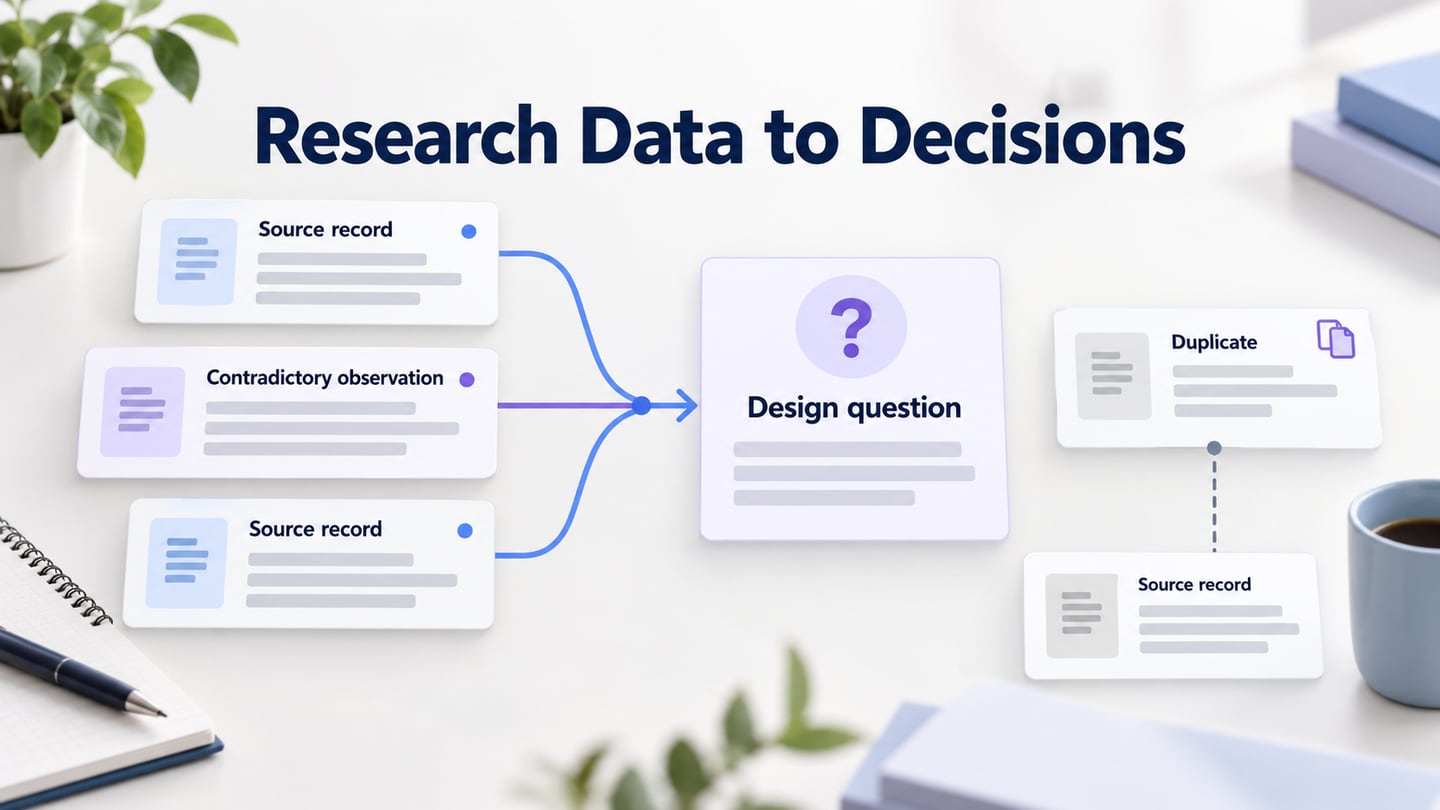
Data analysis in research turns collected records into findings that can inform a decision. It includes preparing the data, looking for patterns, interpreting uncertainty, and explaining what the evidence supports. In UX research, a useful analysis keeps the link between an observation and the design question. It should not remove inconvenient evidence just to produce a positive story.
What is Data Analysis in Research?
Data analysis is the process of organizing, checking, summarizing, and interpreting data to answer a research question. A proposal should explain which records will be collected, how they will be analyzed, and what limitations are expected. The approach may be quantitative, qualitative, or a combination. An everyday judgment can be informed by experience, but formal research needs a clearer record of the evidence and the reasoning.
Analysis can inform a product decision whether performance is improving or declining. It does not guarantee profit or reveal a single correct answer. Separate an observation, such as a participant rereading a workshop time, from an interpretation, such as uncertainty about the timezone, and from a proposed change. GOV.UK’s guidance on analyzing research sessions makes a similar distinction between observations, findings, and actions.

How to Do Data Analysis in Research?
The following six steps keep the work traceable. You may revisit an earlier step when a gap appears, but preserve the original records and document what changed. The goal is an understandable decision, not a perfectly tidy dataset.

1. Define the Required Data
Before collecting data, state the question and the decision it should inform. For example: “Do participants understand which timezone a workshop uses before booking?” Define who to observe, which behavior to record, and what would remain unknown. Planning user research helps keep the method connected to the question rather than to whatever data happens to be easy to collect.
2. Collection of Data
Collect the records specified in the plan, then organize them for review. Keep the source, collection date, task, and participant or record identifier where appropriate. Use anonymized identifiers and respect consent and retention requirements. A note, an analytics event, and a survey response represent different kinds of evidence; do not silently combine them as if they measure the same thing. Define each analytics event in a tracking plan before comparing its counts.
3. Check and Clean the Data
Check for duplicate records, inconsistent formats, missing values, and obvious recording errors. Preserve the raw data and record each cleaning rule. A repeated interview export might be a duplicate; two participants reporting the same difficulty are two observations. Do not discard negative feedback or a long task attempt merely because it complicates the result. Mark uncertain records for review rather than silently changing them.
4. Data Analysis Process
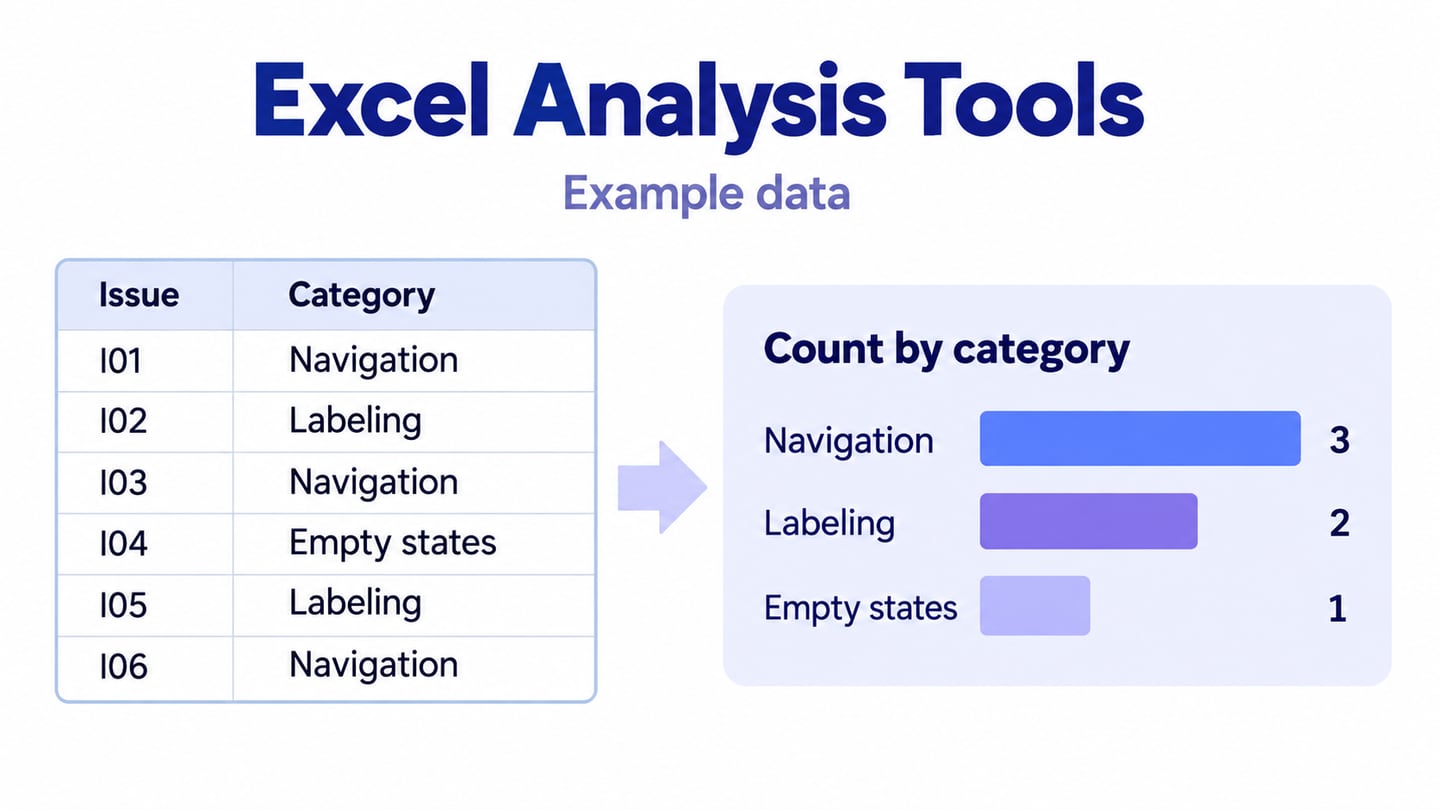
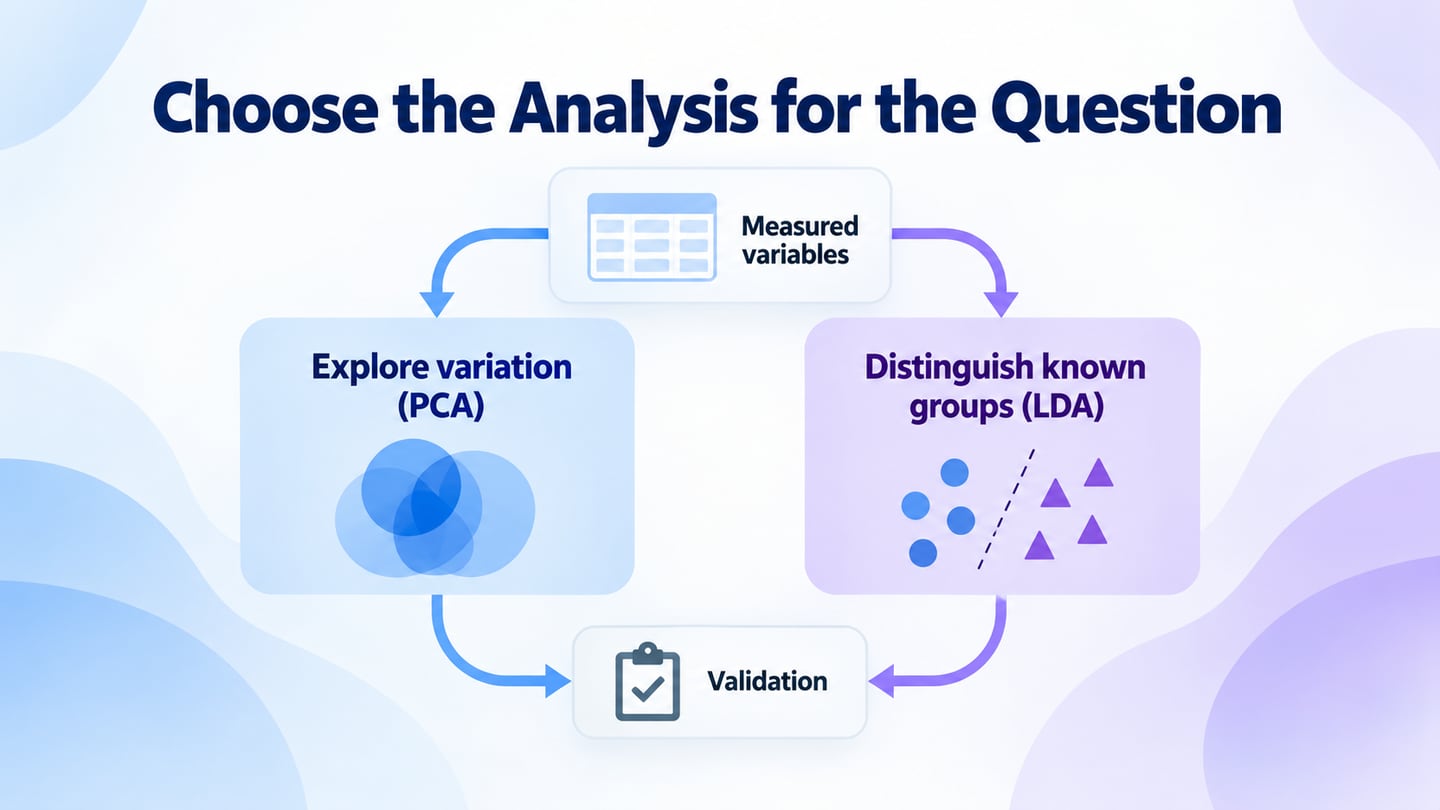
Choose the analysis that fits the question and data. For measured values, descriptive analysis can summarize counts, typical values, and variation. For interviews or observations, group evidence while retaining the source of each note; the research synthesis workflow explains that process in more detail. If evidence is missing, state the gap instead of treating the available sample as complete.
5. Obtained Data Interpretation
Interpret the result in the context of the task, sample, and collection method. Consider alternative explanations and contradictory observations. In the workshop example, rereading the time could reflect timezone ambiguity, an unfamiliar date format, or simple checking. Record which explanation has support, which is a hypothesis, and what further observation would distinguish them.
6. Visualization of Available Data
Use a chart, table, or evidence summary to make the result inspectable. Label units, denominators, periods, and missing values. Keep quotations and measured counts distinguishable, and avoid implying population-wide frequency from a few qualitative sessions. Good data visualization helps a reader examine the evidence; it does not create new evidence or remove uncertainty.
Turn a Finding into a Prototype to Test
Use Mockitt’s prototyping workspace to represent a proposed response once the analysis identifies a question worth testing. For the workshop example, add a visible timezone beside the date and time, then compare that version with the original booking card. Keep the calculation and research records in appropriate analysis tools; the prototype shows the design response rather than running the analysis.
In this illustrative record, participant P03 rereads “10:00” and asks which timezone applies. Preserve that observation, label timezone ambiguity as the interpretation, and test a card that says “10:00 UTC.” The example is synthetic and is not a reported user study. Other observations that point to a different cause should stay in the research record.
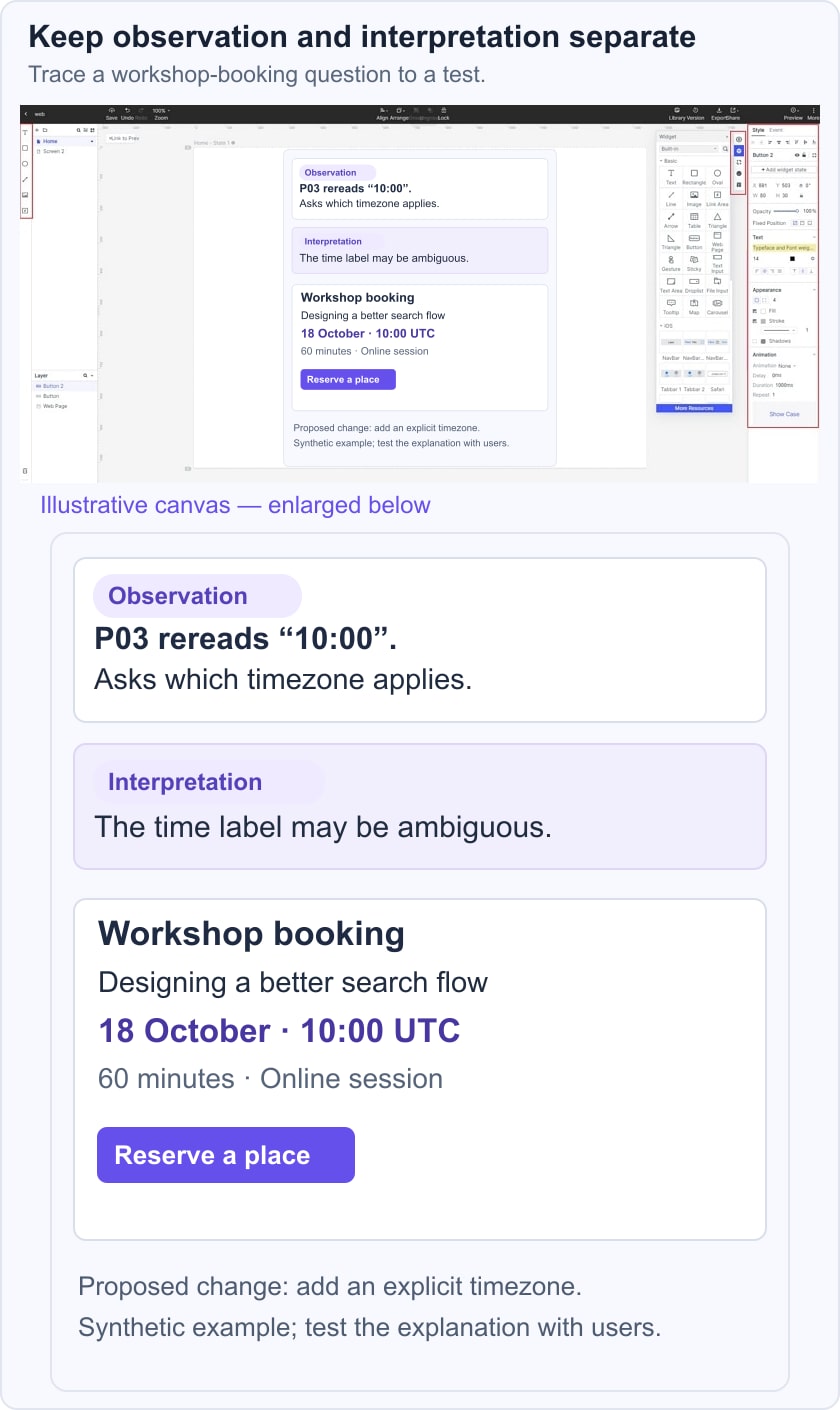
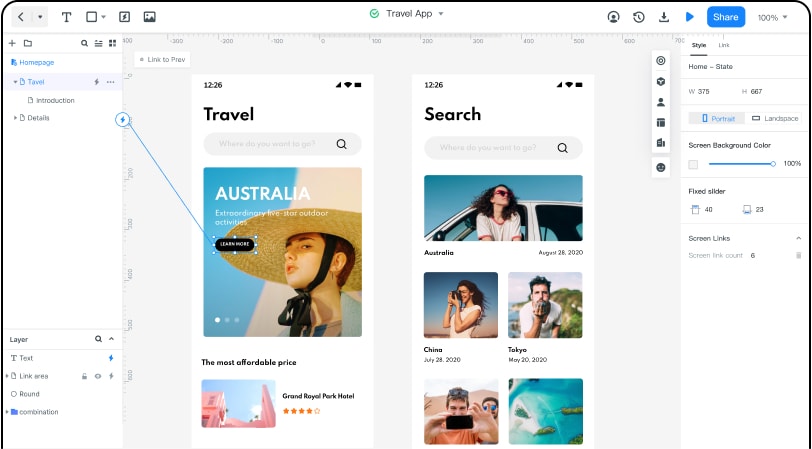
Create a small set of screens that represents the revised task. Use reusable components where helpful, replace placeholder text with realistic content, and include an error or recovery state when it affects the question. The historical screenshot below illustrates the editor, while the new example focuses on the workshop-booking decision. Neither represents evidence that the change has already improved performance.
Share the prototype with the people who need to review it and state the question they should evaluate. Record the revision, the feedback, and the next action. If participants still hesitate about the time, revisit the interpretation instead of declaring the issue solved. A traceable path from source record to finding, proposed change, and follow-up evidence makes the research useful after the presentation ends.