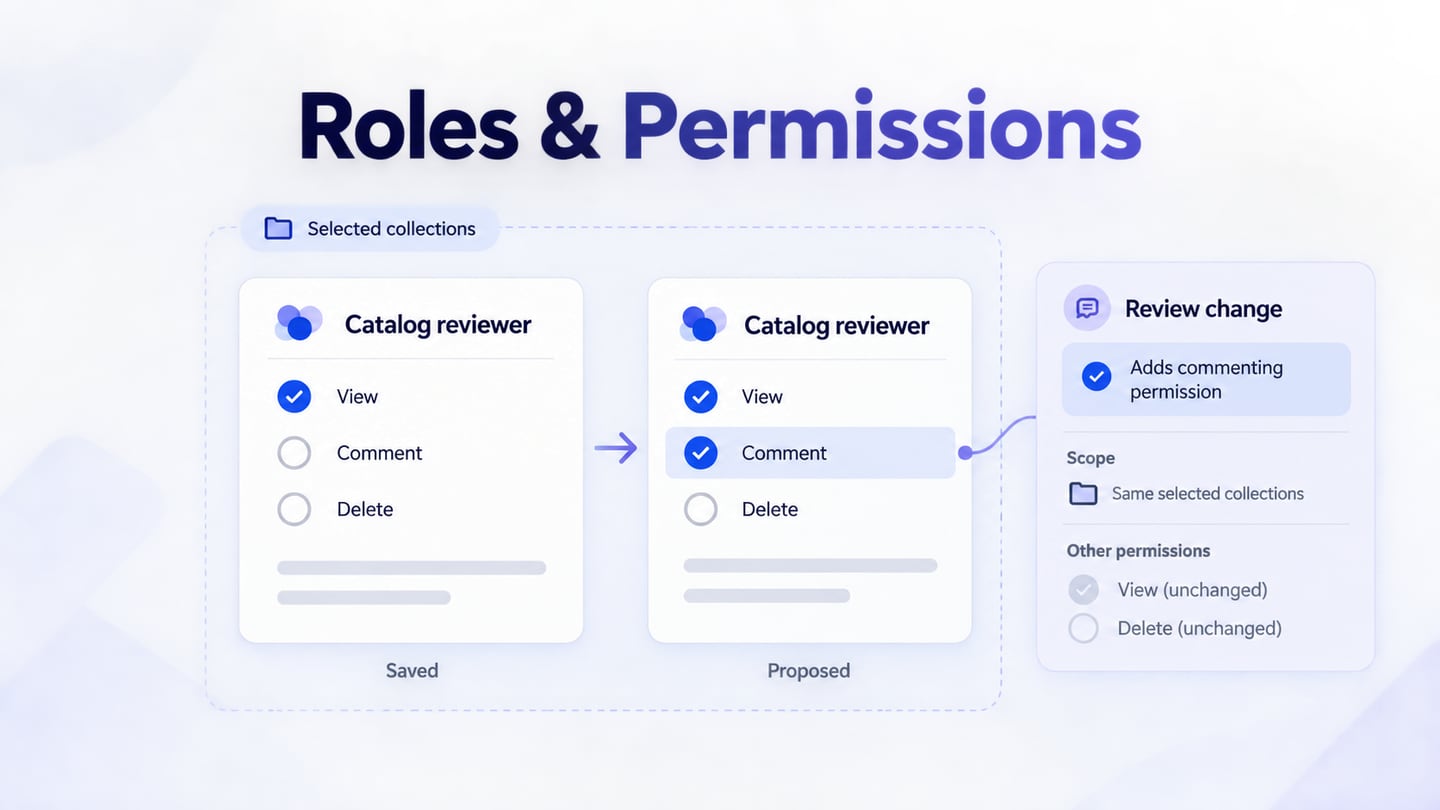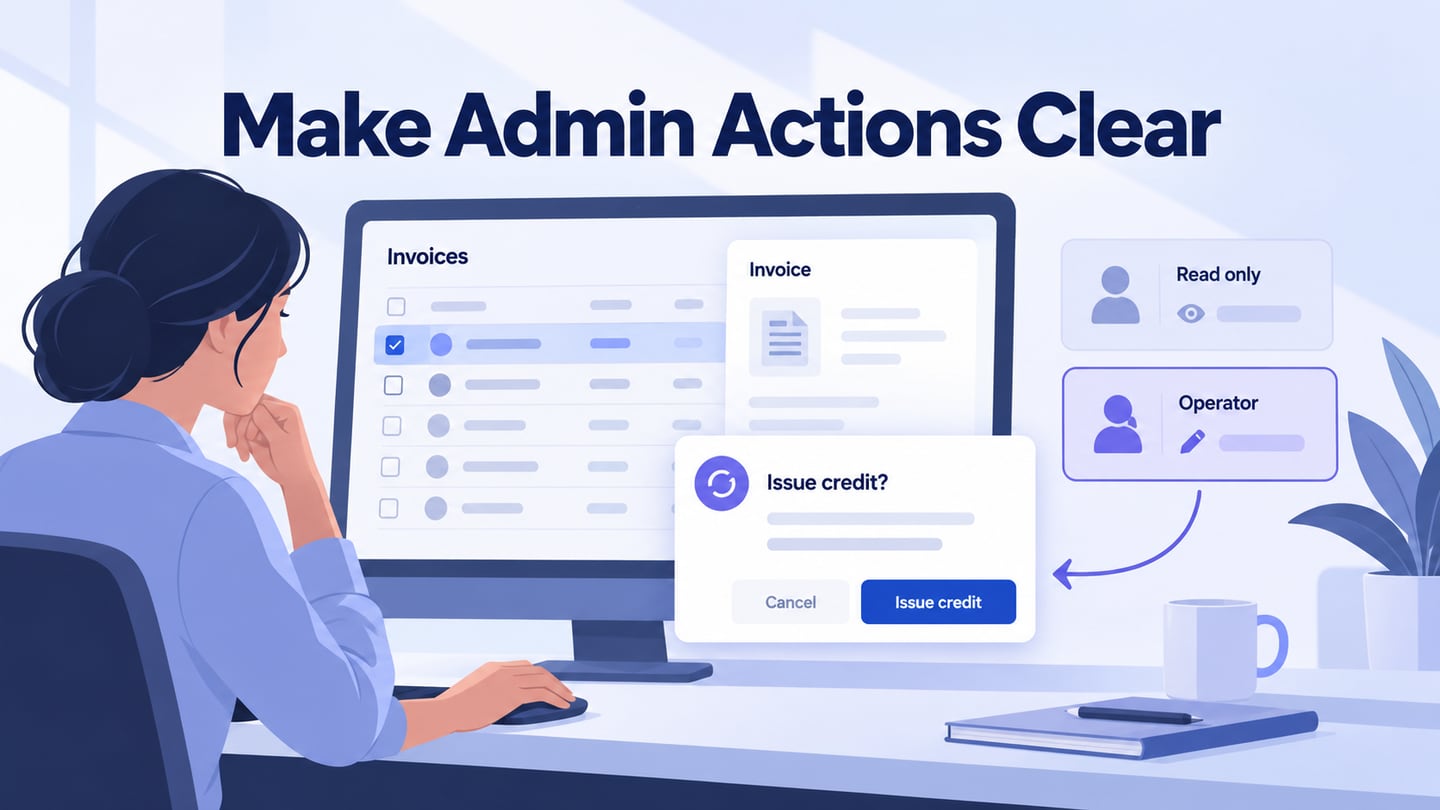
An admin UI needs to help people find the right record, understand its state, and take the appropriate action. The interface and the admin experience develop together; a polished layout is not useful if it hides the work. In Mockitt’s UI design workspace, reusable components can keep tables, filters, and detail panels consistent while the team reviews the task behind them.
An admin dashboard is a central view of a system’s activity and controls. Some panels summarize data; others support managing users, records, licenses, or permissions. Decide which decisions belong on the overview and which require a detail page. A single screen does not need to expose every available administrative action.
10 Admin UI Layout Lessons
The following retained examples show different ways to organize administrative information. Treat the older template screenshots as visual references, not current purchase recommendations or proof of their present features. Study what is visible: grouping, navigation, hierarchy, and the relationship between an overview and its details.
1. Minimalistic Admin UI Design
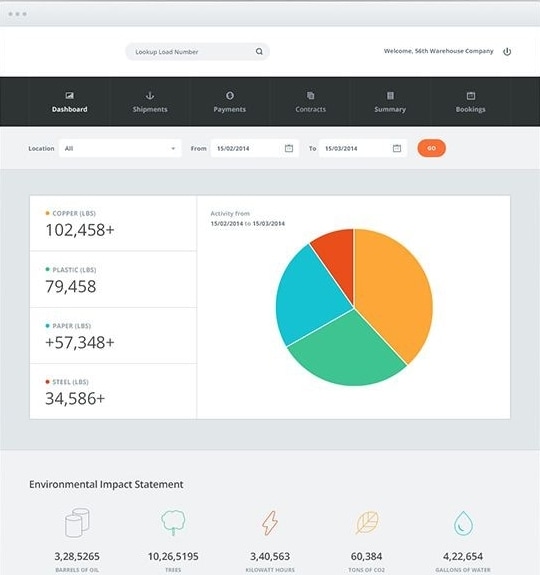
This inventory-style view groups a summary, a chart, and environmental figures under top-level navigation. A location and date filter sit above the data. The useful lesson is to make the active scope visible: an administrator should know which location and period the displayed numbers describe. A screenshot cannot establish whether the underlying filters or data are accurate.
2. Simple Admin Design
An admin panel does not need decorative complexity. In this example, a persistent sidebar and a row of summary cards provide a recognizable structure for moving between areas.
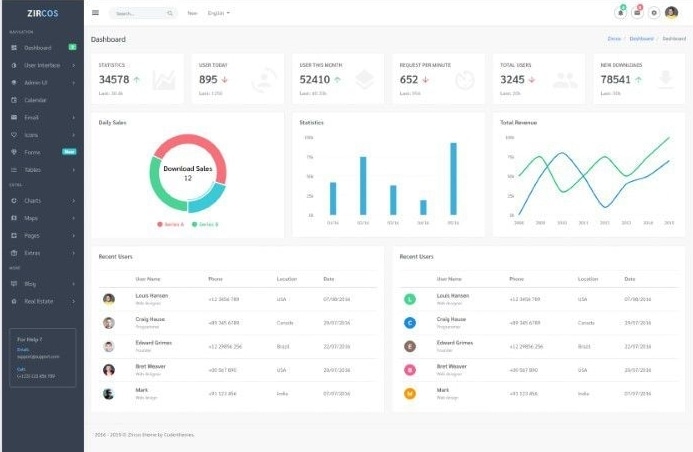
The charts and recent-user table sit below the summaries. That hierarchy can work when the overview answers a quick question and the table supports a specific follow-up. Label metrics with their meaning and period; a large number without context is not automatically useful.
3. Dark Theme of Admin UI
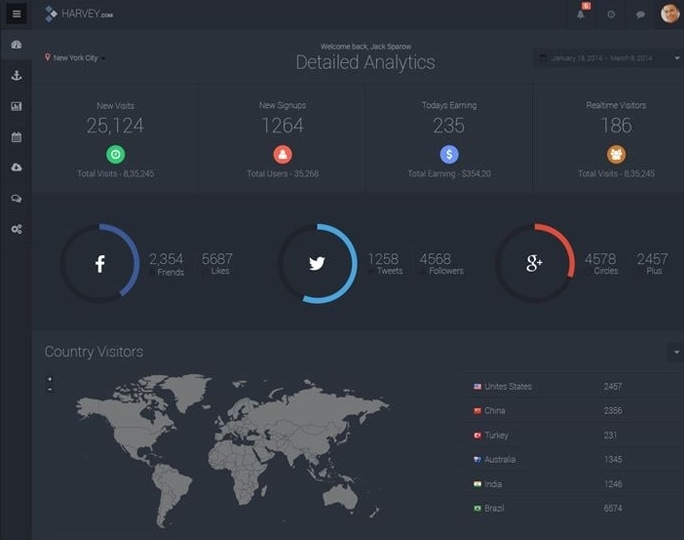
This dark analytics example combines numeric summaries, circular graphics, and a geographic view. Its lesson is consistency in the treatment of different data types. Check label contrast and chart distinctions at the actual display size; dark surfaces and bright marks alone do not establish readability.
4. Visually Connected for Admin UI Design
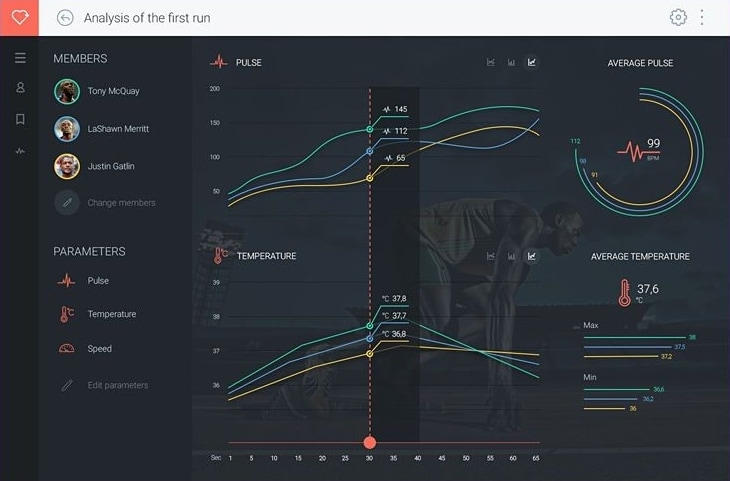
The training view places participant selection beside aligned charts. The vertical marker connects the same moment across pulse and temperature views. This is a useful relationship to study: keep shared time or selection context visible when comparing panels. The image illustrates layout, not medical accuracy or a verified training recommendation.
5. Give Time-Based Data a Clear Scope
Revisit the simple dashboard in example 2: its chart and recent-user table represent different kinds of information. For a time-focused admin task, give each chart a visible period and explain whether the table follows that filter. Avoid changing one panel while silently leaving another at a different date range.
6. Matex Admin Panel UI
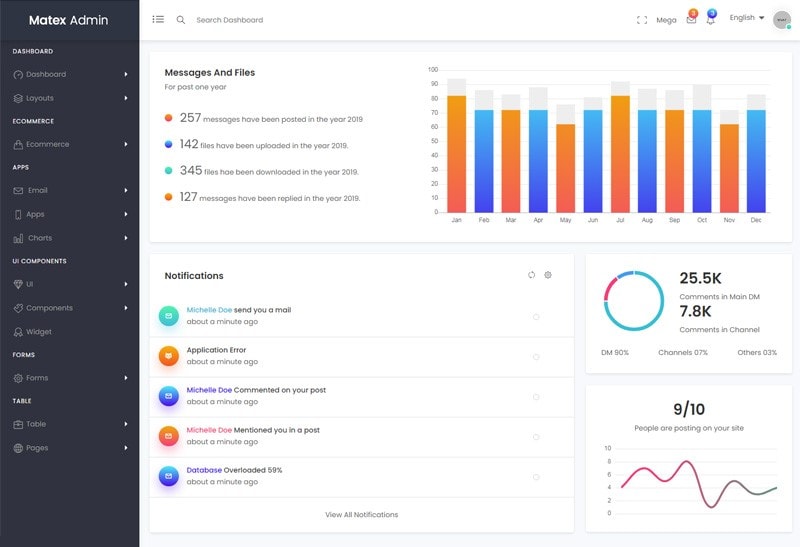
The retained Matex screen groups messages, notifications, and activity charts into separate panels. It demonstrates how a busy interface can use consistent card boundaries and a persistent sidebar. For your own design, decide which notifications require action and which are simply informational; identical visual weight can hide that distinction. Current template licensing and component availability are outside what this screenshot verifies.
7. Limitless - Responsive Admin Panel UI
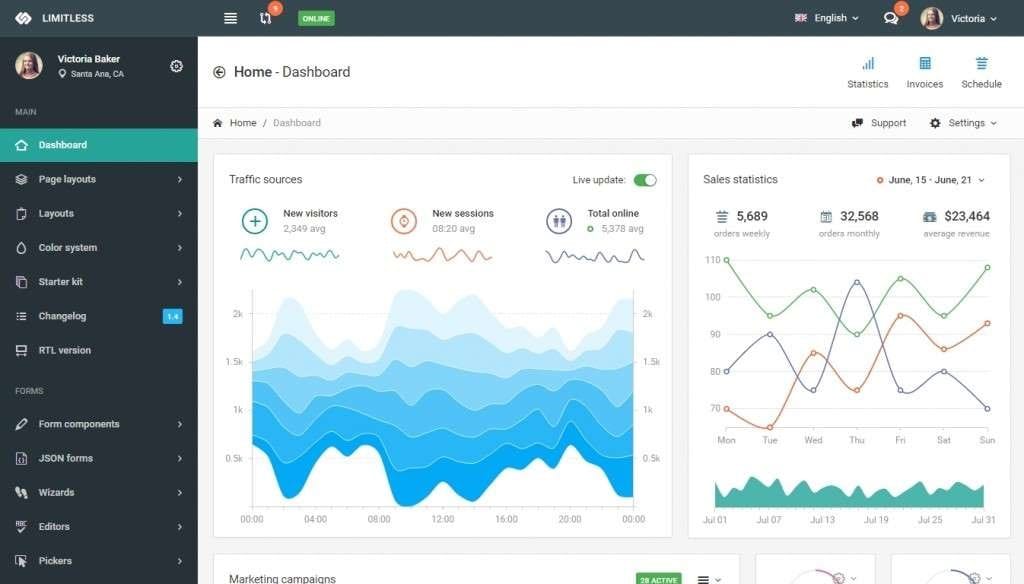
The Limitless example places traffic and sales charts side by side, with a visible date range and view controls. The comparison is useful only if labels and time periods are clear. On a smaller screen, stack or reprioritize panels instead of squeezing every desktop chart into a narrow column. Do not infer present browser support or framework compatibility from an archived image.
8. Gleek
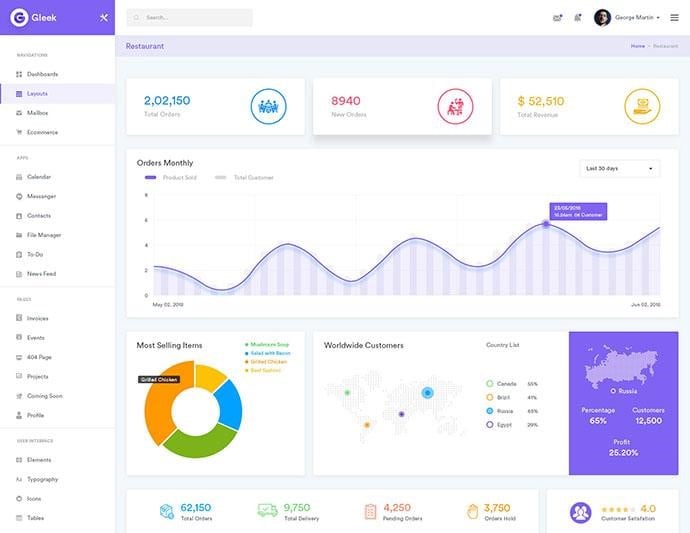
The Gleek example uses a prominent orders chart with smaller supporting summaries and geographic information. The design lesson is to choose a primary question for the overview. If the user’s immediate task is handling an exception, a large trend chart may be less useful than a filtered list of records that need attention.
9. Mintone - Modern and Flexible Admin Panel UI
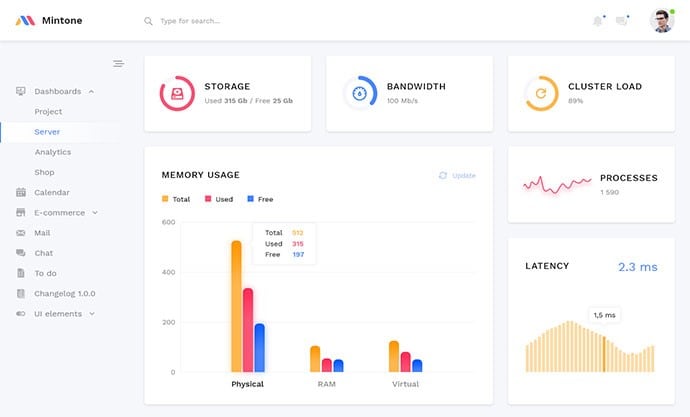
The Mintone screen groups storage, bandwidth, cluster load, memory usage, and latency. These values have different units and meanings, so the labels are as important as the chart forms. In a system-status panel, distinguish unavailable data from a healthy zero and show when the information was last updated. Do not rely on color alone to explain a warning.
10. Clean UI Pro: Comparing Related Metrics
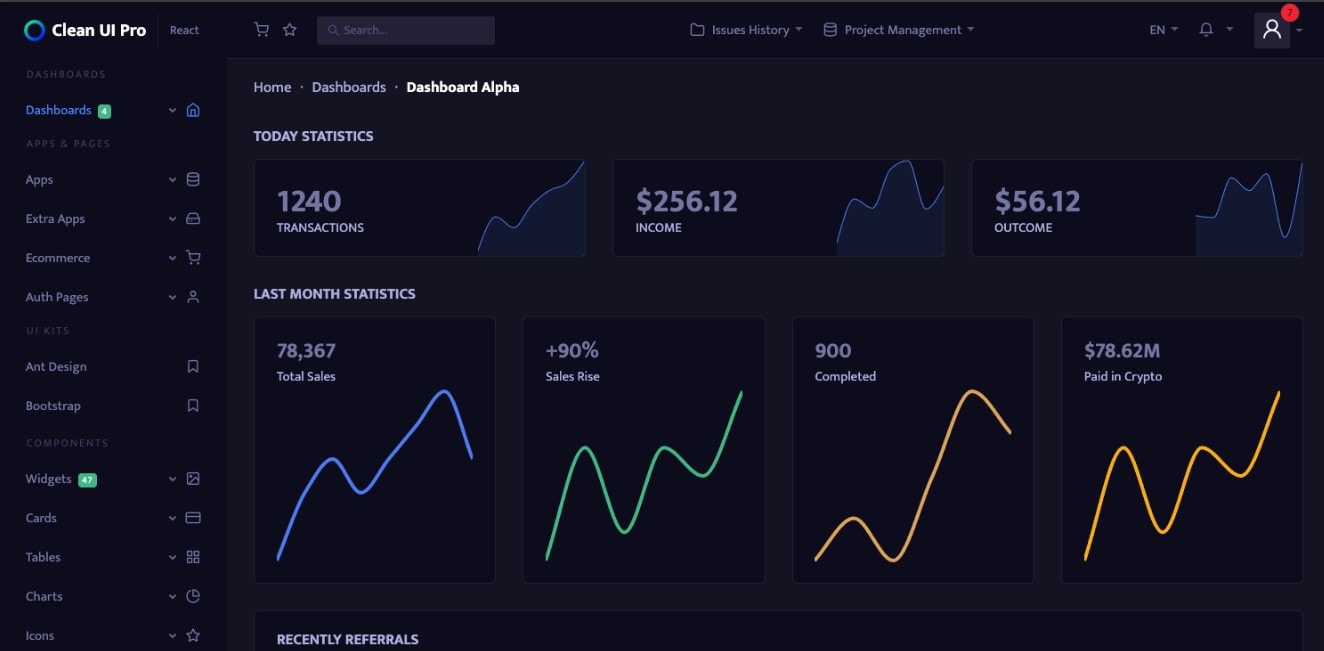
The retained Clean UI Pro image uses repeated cards and line charts for transaction, income, and outcome summaries. Repetition can make related metrics easier to compare when their scales, units, and periods are stated. Keep a visual comparison from implying that unlike measures share the same scale. This older example is a layout reference, not a claim about the current package or its included pages.
Explore an Admin UI with Mockitt
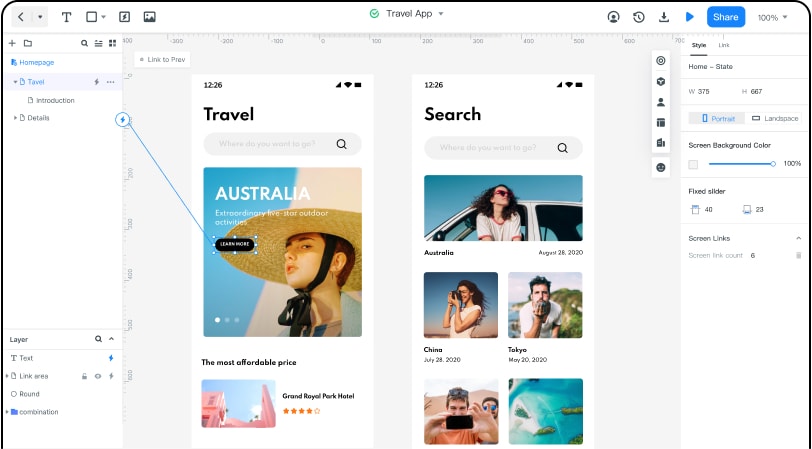
Mockitt can help turn an admin layout into a reviewable flow. Use connected prototype screens and states to show what happens when someone selects a record, changes a filter, or reviews an action. This is where the team can inspect missing feedback before implementing the real system.
Capabilities useful for this work include:
- Reusable components and UI resources for repeated tables, controls, and panels.
- Editable component properties and states for meaningful variations.
- Interactions and transitions that show how an action changes the view.
- Connections between screens or states, including cancellation and recovery paths.
- Preview and sharing so stakeholders can follow the intended task.
- Comments attached to the relevant design context.
- Shared editing and collaboration in the browser workspace.
- Inspectable design information and code drafts as supporting handoff material, subject to implementation review.
- Templates as a starting point, adapted to the actual task and content.
- Consistent component choices that the team can reuse across related admin views.
- A focused prototype scope that makes the important action understandable without simulating every backend feature.
How to Create Admin UI Design
Start with an administrative task, not an empty dashboard full of sample charts. Choose the record, the person’s role, and the result they are allowed to request. Use realistic fictional data and include the state that appears after the action.
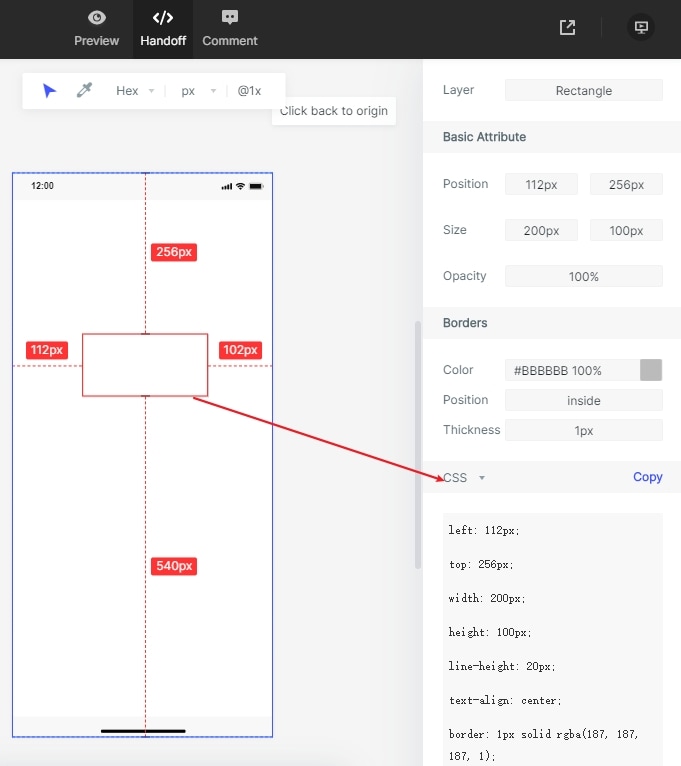
A high-fidelity prototype can illustrate behaviour, but it is not a working authorization or financial system. The following steps use a concrete action to make that boundary clear. The retained Mockitt captures show earlier guide interfaces; use equivalent controls in your current workspace.
Prototype the action that carries risk
In an illustrative invoice admin panel, a viewer can inspect invoice INV-204 but cannot issue a credit. An operator can open “Review credit,” inspect the amount and reason, and cancel before confirmation. Show the different role views explicitly rather than merely coloring the same button gray.
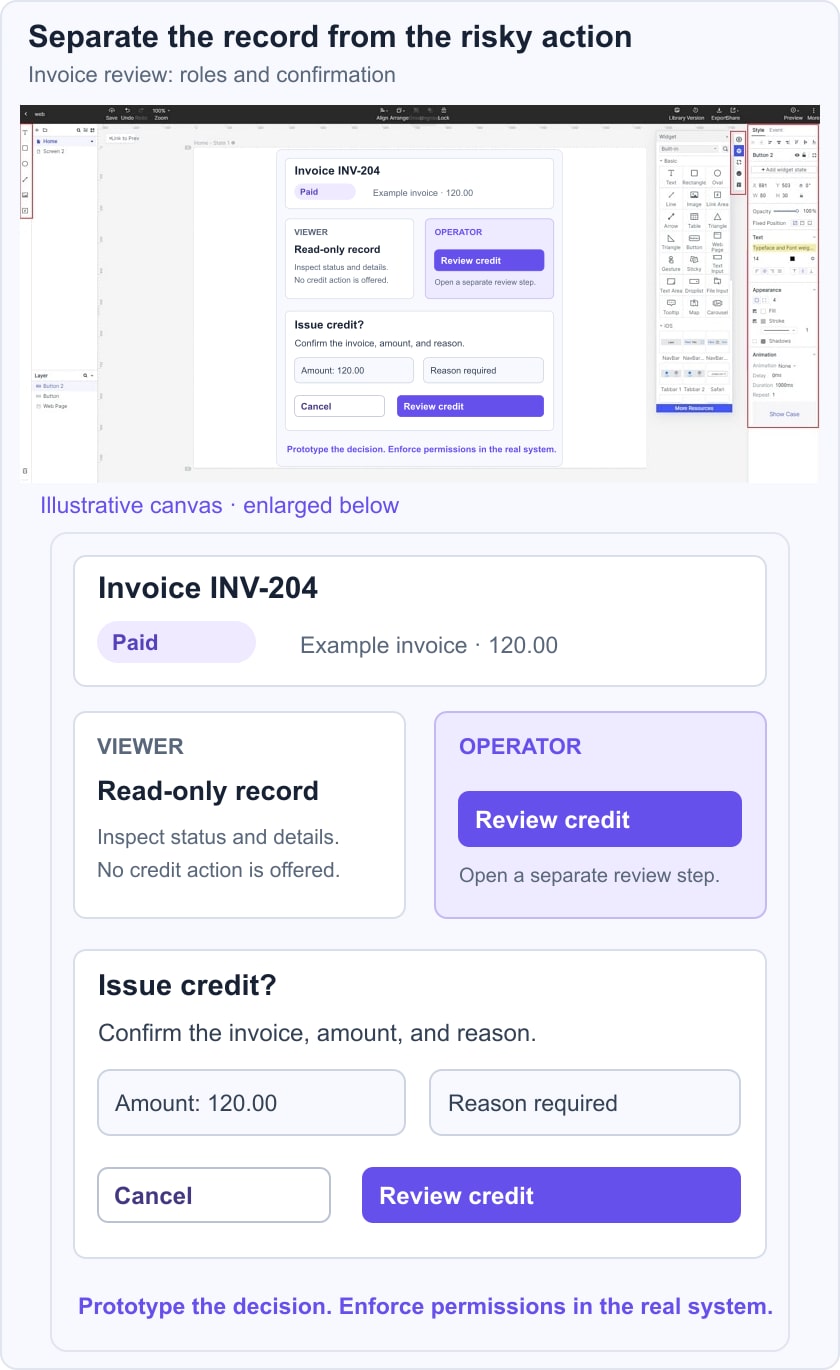
For the review, ask someone to find the invoice, explain its paid status, and describe what the next action will do. Include a confirmation state that identifies the invoice and the requested amount. If the person mistakes “Review credit” for an immediate transaction, revise the label or flow. Developers must enforce authorization and validate the transaction separately; hiding a button in the prototype is not a security control.
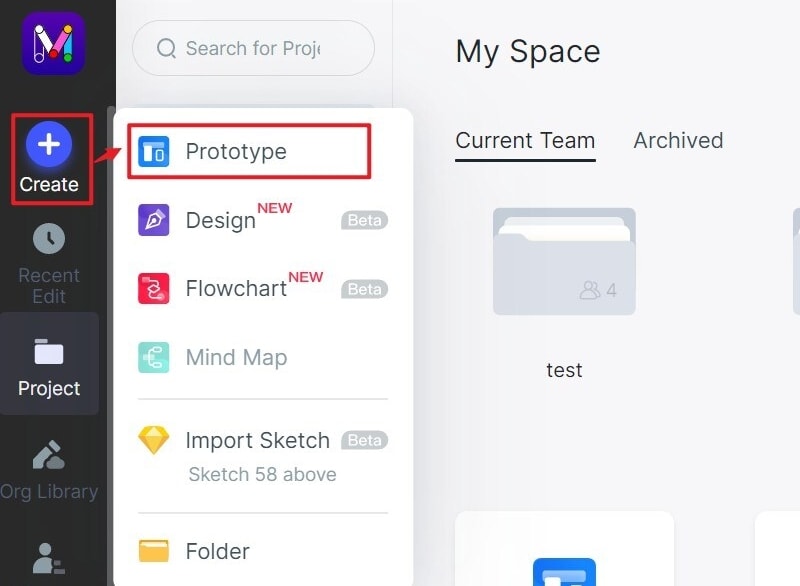
Step 1. Create the task screens. Create a prototype project with an appropriate desktop size. Name the screens for the work: invoice list, invoice detail, credit review, and confirmation. The original guide image shows an earlier Create menu; its useful lesson is to establish the project and target screen before placing content.
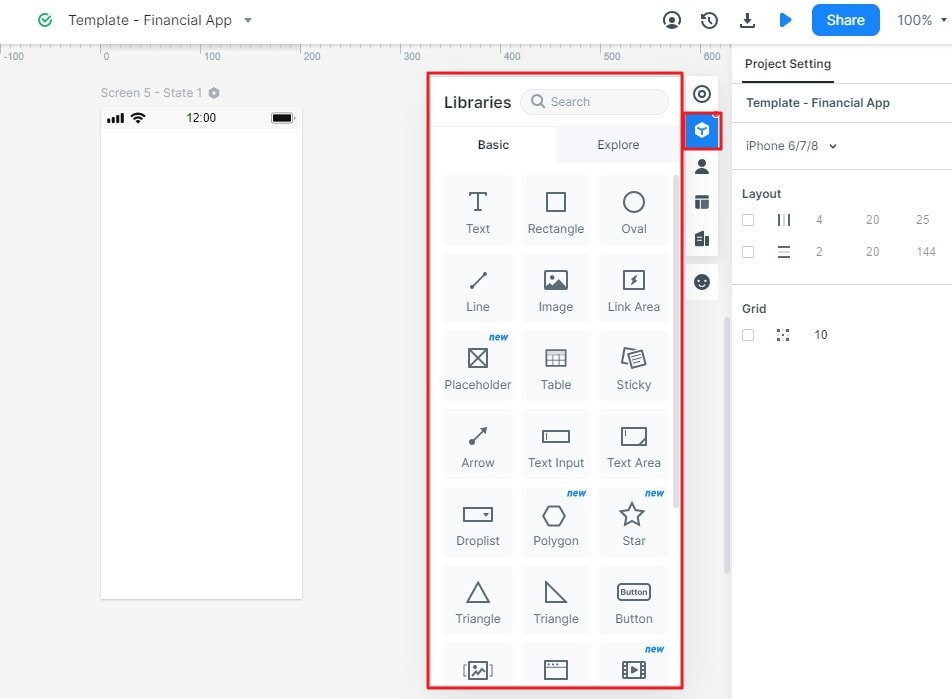
Step 2. Add and organize components. Use available UI components for the record list, status label, detail fields, and action controls. Keep repeated rows and filters consistent. Show a realistic invoice reference and amount rather than filling the table with unexplained numbers.
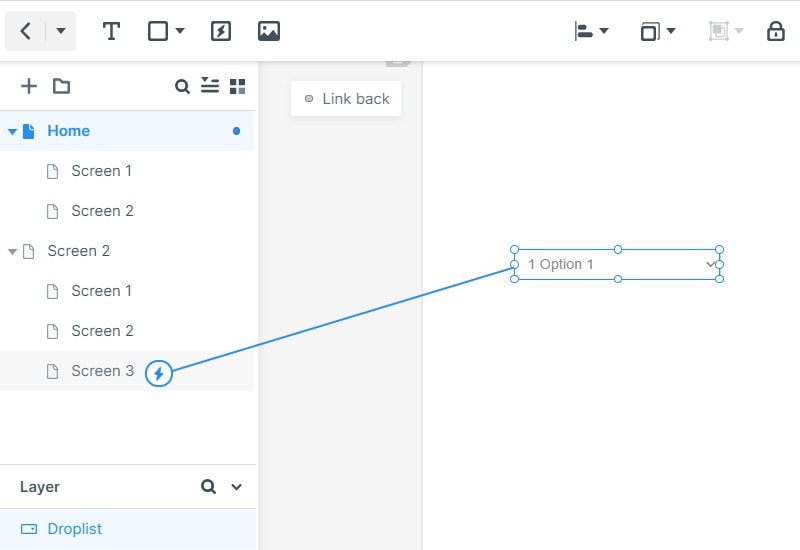
Step 3. Connect the actions. Link the selected invoice to its detail view and the review action to its confirmation state. Connect Cancel back to the detail without implying that a credit was issued. The guide capture illustrates a component-to-screen connection; verify both the forward and return paths in preview.
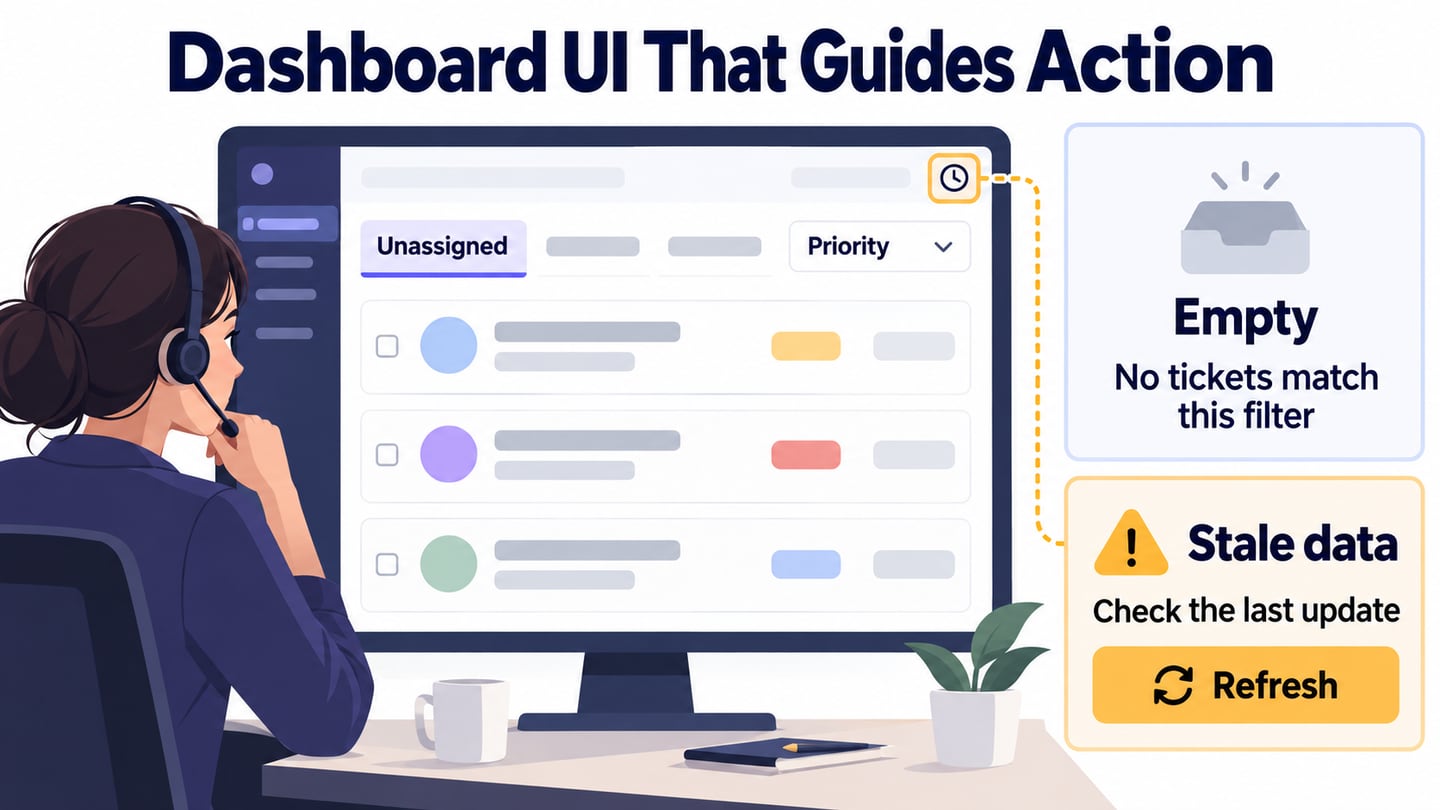
Step 4. Review the layout with the task. Templates can suggest a starting arrangement, but check whether the chosen structure supports this admin action. Look at the viewer and operator variants, long record names, missing values, and an empty filter result. Record specific changes rather than approving the screen only because it looks complete.
For handoff, share the reviewed flow, the allowed actions for each role, and the required error and confirmation states. Provide design specifications where available. Code drafts and style inspection do not supply real permissions, data validation, transaction handling, or implementation testing.