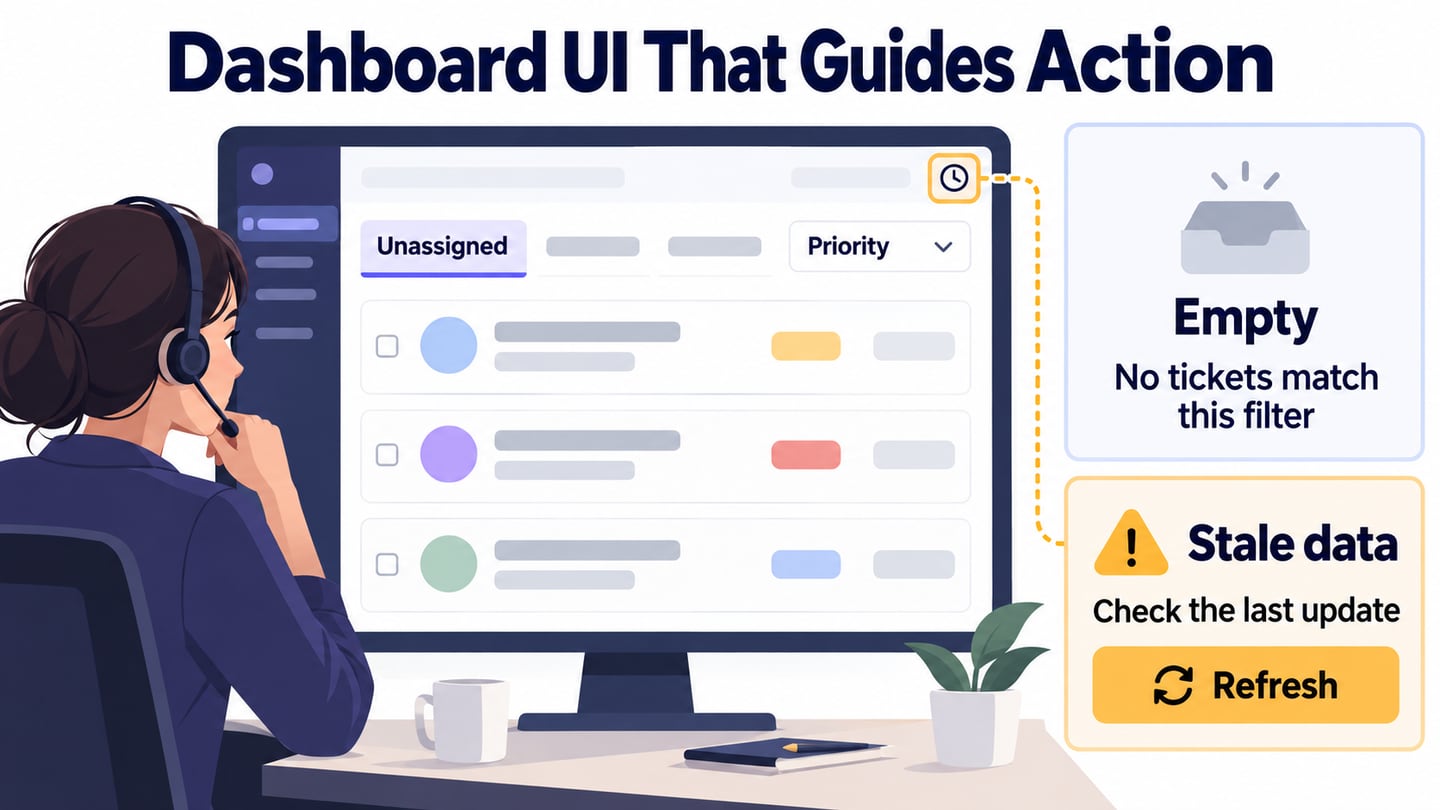
A dashboard brings together the information someone needs to understand a situation and decide what to do next. The relevant summary depends on the role: a dispatcher, accountant and support lead need different views. The ten use cases below retain the original article’s range of dashboard topics, followed by practical design rules and a support-queue walkthrough.
For a data-heavy product, a dashboard prototype helps the team review filters, loading states, and empty results before implementation.
Ten Dashboard UI Design Use Cases
1. Micromobility: Availability and Exceptions
A micromobility dashboard needs to distinguish available vehicles from those needing attention. The original Ramotion reference is useful as a starting theme, but visual polish does not establish operational usefulness. For your own example, define the coverage area, show the last refresh time and give a route from an alert to the relevant vehicle. Review whether someone can distinguish “no vehicles available” from “availability data unavailable.”
2. Public-Health Information: Trends With Context
A public-health dashboard needs clear definitions, date ranges and data sources beside its charts. A large number without its population or reporting period can be misleading. Keep a region filter visible and distinguish a recorded zero from a missing report. The design question is whether the reader can interpret the trend and its limits, not whether the colors look impressive.
3. Task Management: Work That Needs Attention
The Maise task-dashboard example points to a common need: distinguish assigned work, overdue work and upcoming deadlines. Evaluate that structure with realistic task names and an empty project as well as a busy one. A component library or page-template count does not establish that the hierarchy answers the team’s next question.
4. Local Events: Calendar and List Views
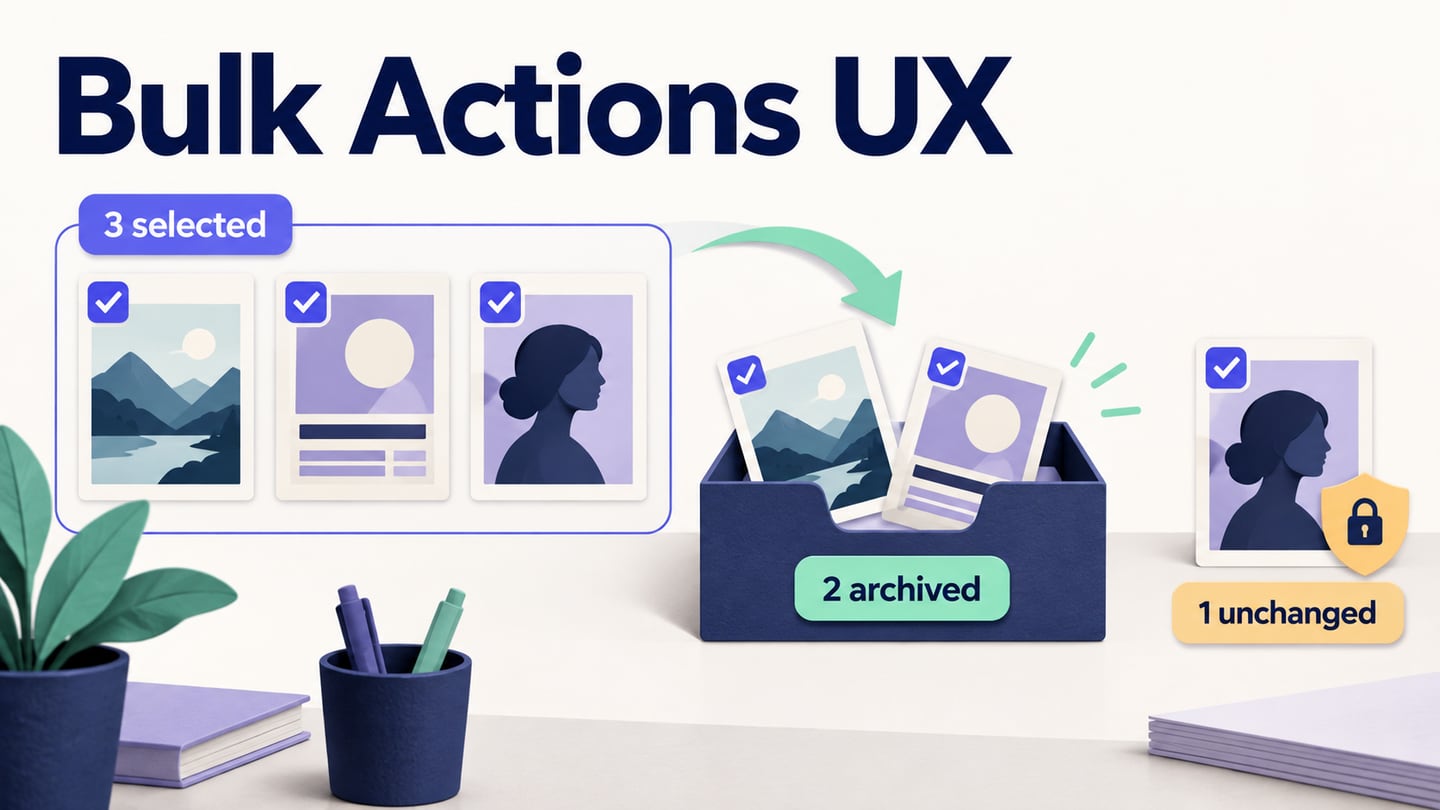
A calendar helps place events in time, while a list can expose titles, locations and availability more directly. Let the person reach event details by an explicit action, with keyboard and touch access, rather than relying only on hovering over a date. Include an example with several events on one day and another with none.
5. Smart Home: Reported State and Pending Commands
A smart-home dashboard should separate a device’s reported state from a command that has merely been requested. “Closing,” “Closed” and “Device offline” mean different things. A prototype can review how these states are communicated, but a screen design alone cannot demonstrate that connected hardware responds. Show when a state was last received and what to do if it is stale.
6. Accounting: Totals That Lead to Records
An accounting dashboard can summarize unpaid invoices and lead to the records behind a total. Confirm the date range, currency and status definitions before designing the headline figures. The original article described an older offline desktop workflow for Frappe Books; the current official product page describes a self-hosted browser application and states that the old desktop app is no longer supported. Do not use the previous platform description as current guidance.
7. Personal Budget: Planned and Actual Spending
The Tinetik budget reference raises a useful comparison: planned spending versus recorded spending for the same period. Label which amount is remaining and how transfers or pending transactions are treated in your proposed design. A category breakdown should help explain the total instead of repeating it in a different shape. Use fictional financial values when reviewing the layout.
8. Meal Planning: Today’s Plan and Missing Information
A meal-planning dashboard can show the day’s planned meals and a route to recipes or a shopping list. Keep recorded values distinct from estimates and avoid implying that a chart provides medical advice. Check what appears when a meal has not been logged; an empty record should not silently become a confirmed zero.
9. Payment Operations: Status and Follow-Up
The Ripple Net reference suggests a payment-status overview. For a comparable design exercise, group items by states such as pending, completed and requiring attention, with a route to transaction detail. A decorative logo or minimal layout is secondary to the meaning of each status. A visual prototype cannot establish settlement, authorization or the security of an actual payment service.
10. Order Lists: Changes Without Losing Context
An order dashboard needs readable rows, useful status filters and a clear route to an order. If a row changes or disappears after an action, communicate the result so the person can follow what happened. Animation may support that transition, but it should not be the only indication of a changed state or prevent continued work.
Ten Rules for Designing the Dashboard
1. Start With the Role and Decision
Write the decision the dashboard should support. In the walkthrough below, a support lead needs to find unassigned high-priority requests and decide which to assign first. That goal determines the summary cards, filters and columns. Validate the goal with the people doing the work before adding metrics simply because data is available.
2. Match the Representation to the Question
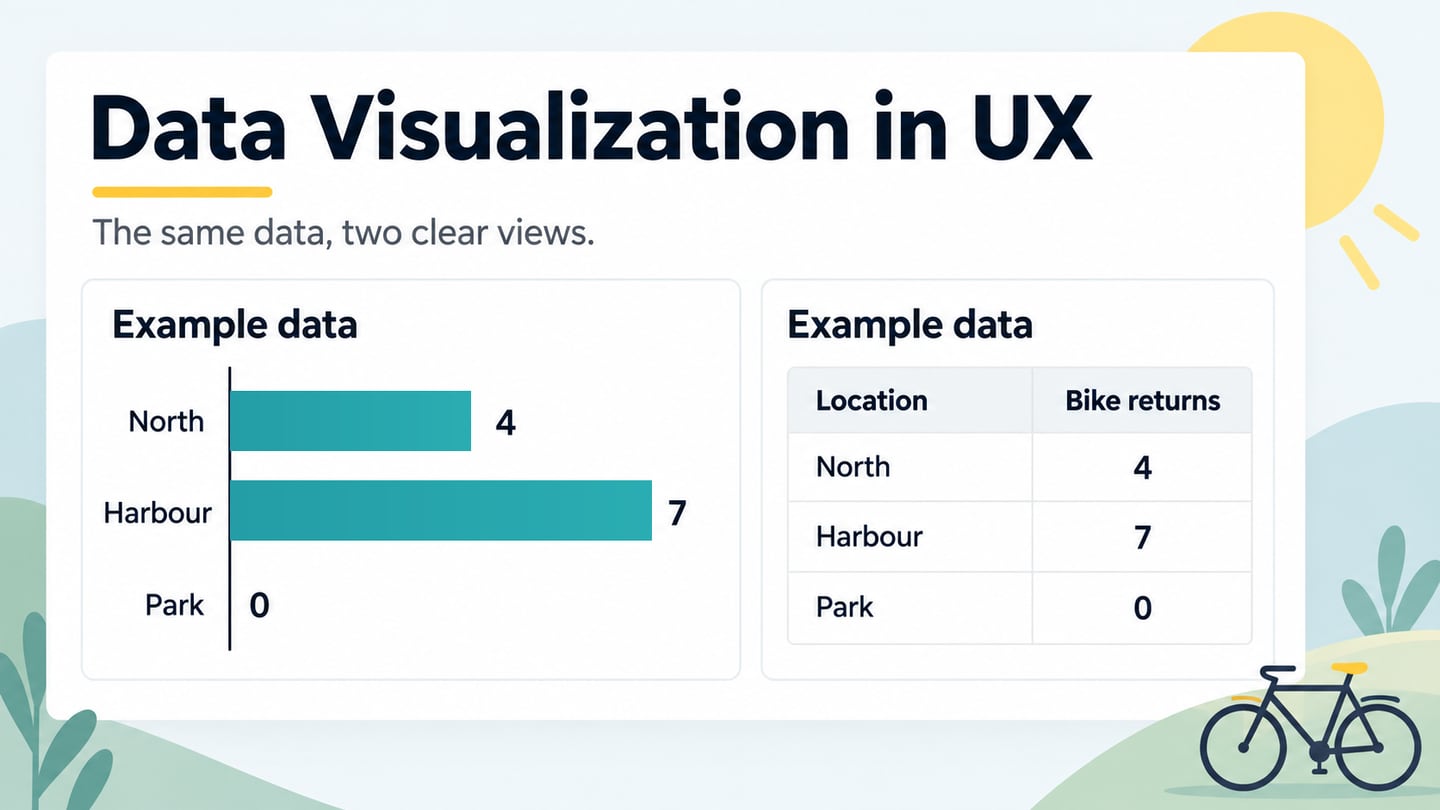
Use a number for a current total, a line for change over time and a table for records that need comparison or action. Label units and time ranges. Avoid decorative depth or styling that makes values harder to compare; choose a gauge only when its range and threshold carry a meaningful message. Check whether the same information needs a text or tabular alternative.
3. Keep Labels and Metric Definitions Consistent
Use the same term for the same concept across cards, filters and detail pages. If “Unassigned” excludes closed requests, say so in the definition and apply that rule consistently. A change in date range or scope should be visible wherever it changes the meaning of a number.
4. Create a Clear Reading and Action Order
Use a grid to align summaries and controls, then place the most important information according to the task and reading direction. For the support lead, put the queue scope near the summary and keep filters close to the table they affect. Check the order again when columns stack on a narrower screen.
5. Reuse Structure Where the Meaning Matches
Cards can group a metric, label and explanatory detail, but not every dataset needs a card. Keep comparable metrics structurally consistent and use a table when row-by-row comparison is the task. A reusable component helps maintain presentation; it does not decide which information belongs together.
6. Use Spacing to Show Groups
Space related labels and values more closely than unrelated sections. Use a consistent spacing scale rather than mechanically doubling every margin. Review long labels, translated text and narrow layouts so extra white space does not push the main action out of context.
7. Make Summary and Detail Work Together
Show the information needed for the first decision, then provide a clear route to detail. Scrolling is acceptable when the order remains understandable. Do not squeeze all records above the fold or hide essential definitions behind hover-only controls. Keep the selected scope visible when a person moves between a summary and its records.
8. Give Customization a Clear Default
Role-based views, saved filters or configurable columns may help recurring tasks, but the initial view still needs to work. Explain which settings are personal and which affect a shared view. Include a way to recover the intended default and check whether a saved filter could conceal new work.
9. Design Tables for Comparison and Action
Choose columns based on the decision, align values consistently and use explicit labels for row actions. In the support queue, show request, priority, waiting time and assignee. Make the active sort and filters visible. For a narrow layout, preserve the information needed to identify and act on a request rather than just shrinking the desktop table.
10. Design Loading, Empty and Failure States
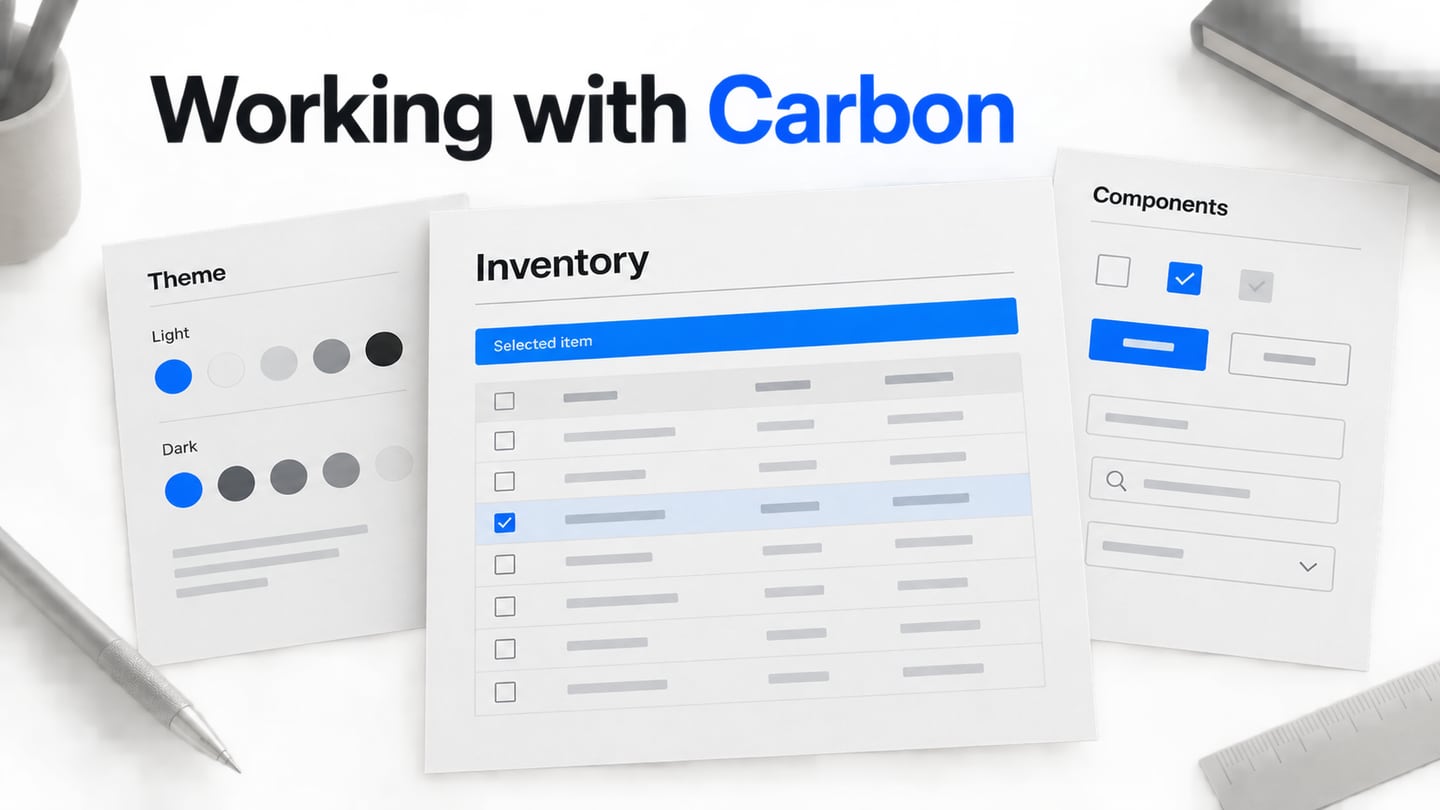
Design the dashboard alongside its detail views so summary and record states agree. Include initial loading, no records, no filter matches, stale data and a retrieval error. Carbon’s empty-state guidance distinguishes different causes of missing content. “No unassigned requests” is a useful result; “Could not load requests” calls for a different explanation and recovery action.
Prototype a Support-Queue Dashboard in Mockitt
Use the Mockitt design workspace to compose a fictional support queue, then connect the states in the prototype workflow where the review needs interaction. Start with “Unassigned,” “Oldest waiting,” a priority filter and a request table. The example is a design exercise, not a connection to a live support system.
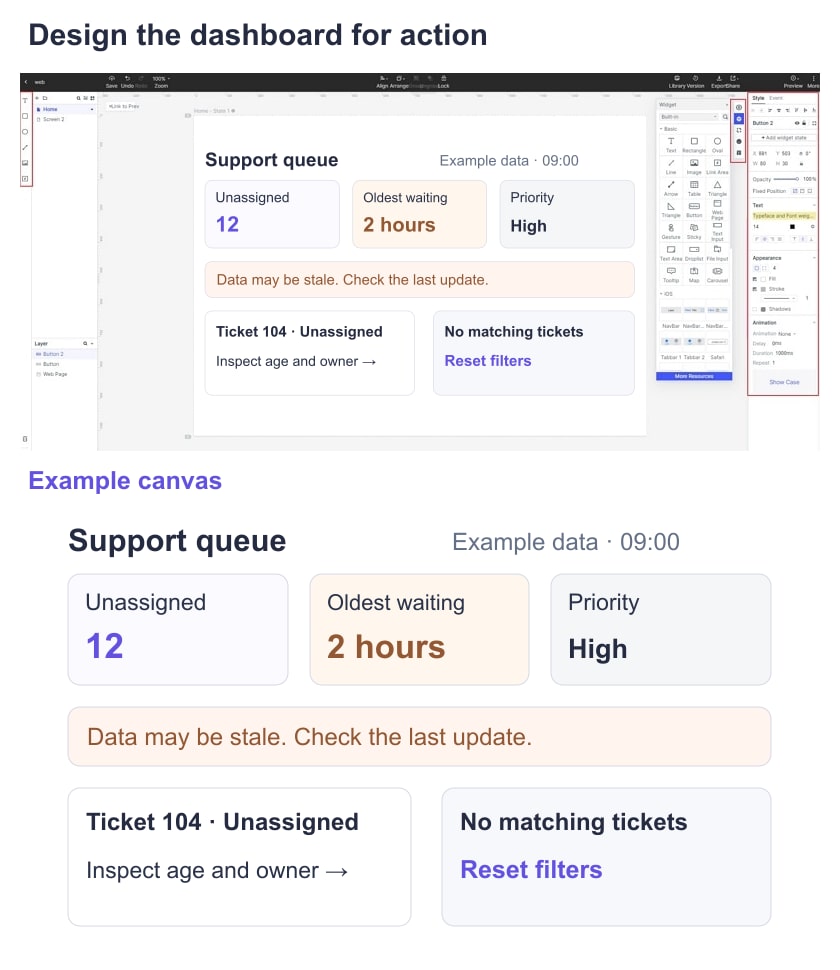
Create a normal queue, a filtered queue and an unavailable-data state with the same visual system. Use realistic but fictional request titles and avoid personal customer information. The retained older screenshots illustrate basic editor operations; their control positions may differ from the current interface.
Prepare the version and recipient access for the review. A shared prototype can communicate proposed behavior and collect feedback; it does not verify live permissions, data freshness or an actual assignment service.
Build and Review the Support-Queue Example
Step 1: Define the Queue and Create the Screens
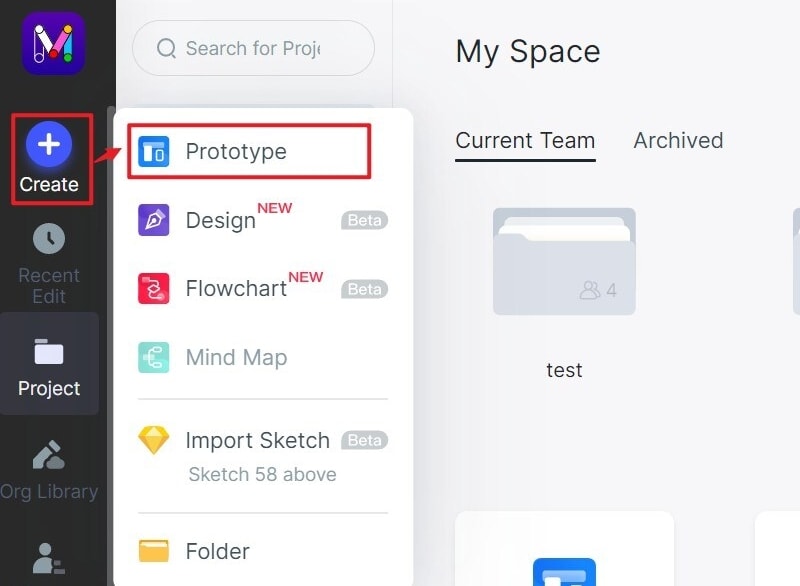
- Create a project for the intended review viewport. Name the screens “All open requests,” “High priority,” “No matches” and “Data unavailable.” Define “waiting time” as time since the request was created for this exercise, so the labels have an explicit meaning.
- Add a narrower layout if the support lead needs that context. Keep the same fictional requests and priority labels in each version so the comparison concerns layout rather than different data.
Step 2: Add Metrics, Filters and State Feedback
- Place the summary cards above the queue and add a visibly labeled priority filter. Use sample values such as “12 unassigned” and “Oldest waiting: 2 h,” identified as illustrative. In the table, keep request title, priority, waiting time and assignee aligned.
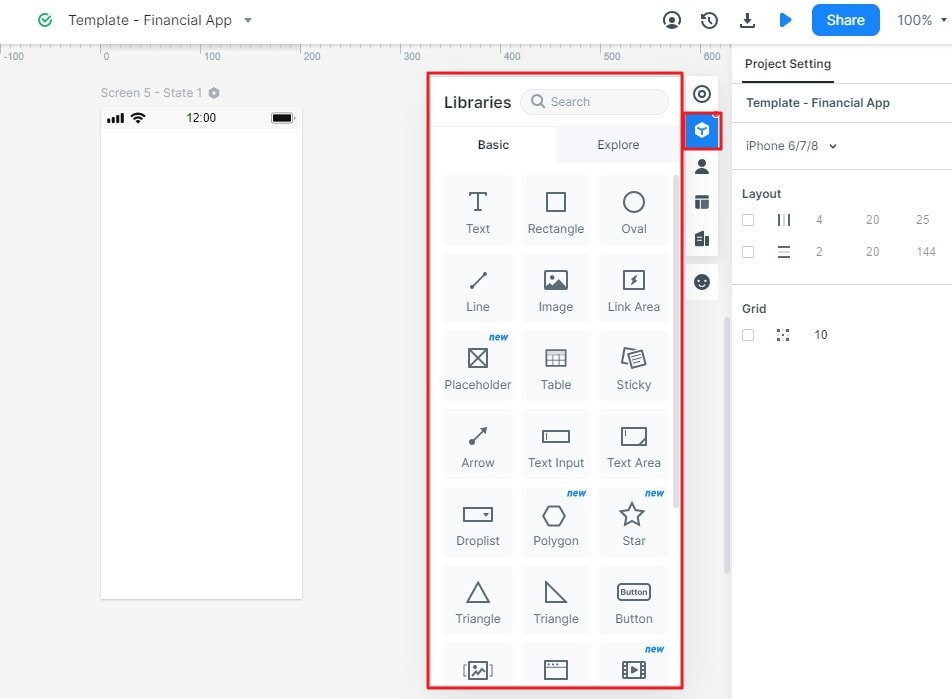
- Connect the high-priority filter to its proposed result. Keep an active-filter label and a clear reset action. A summary that changes with the filter should state its scope; otherwise readers may assume it represents the whole queue.
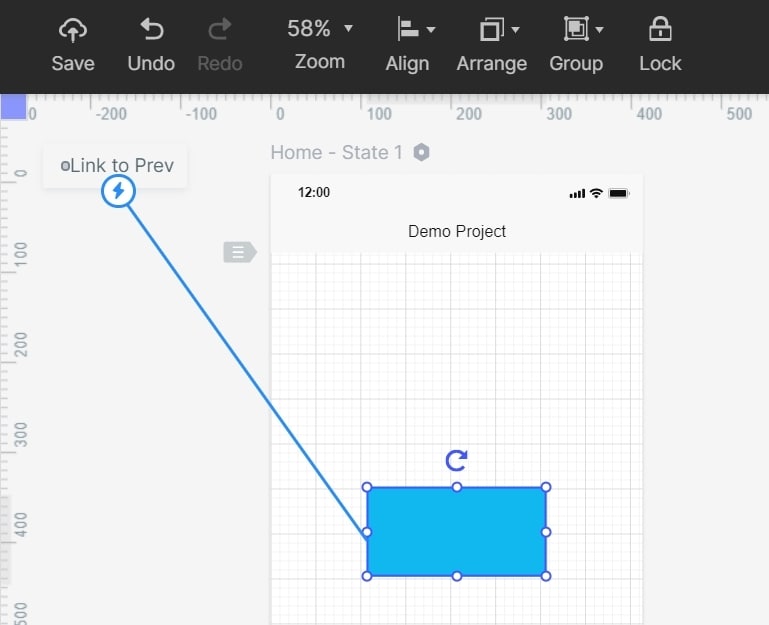
- Annotate the proposed behavior beside the relevant state: which data changes with the filter, what “Updated” means and what the retry action is expected to do. Mark backend assumptions as implementation questions.
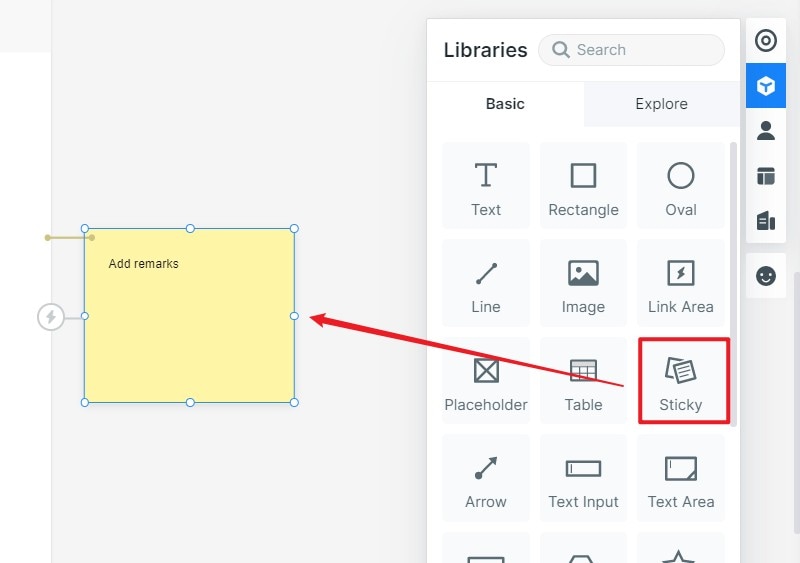
- Add distinct states for “No requests match this filter” and “Could not load requests.” Show previously loaded data as stale only if that is the intended behavior, and preserve its last successful update time. Do not display a failed request as a zero count.
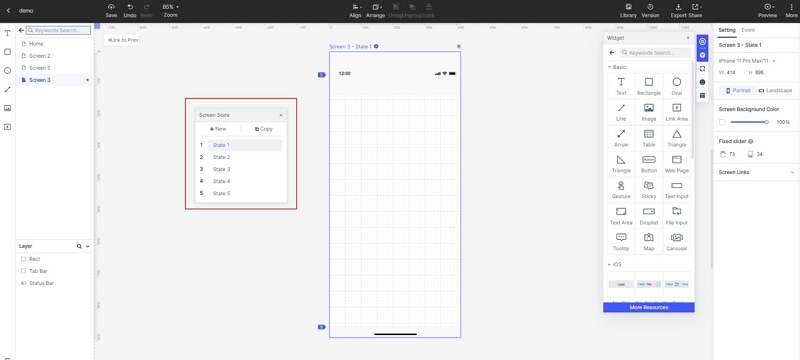
Step 3: Observe a Concrete Review Task
- Ask a reviewer to find the oldest unassigned high-priority request, then remove the filter. Next show the unavailable-data state and ask whether they believe the queue is empty. Record the action they chose and their interpretation; do not report a usability improvement without an actual comparison.
Step 4: Share the Decision and Remaining Checks
- Share the reviewed prototype with its metric definitions and unresolved states. Retain the screen version and the observations supporting any layout changes. Before release, the implementation still needs checks for data accuracy, permissions, keyboard access and real loading or failure behavior; a successful prototype review is not a production launch.