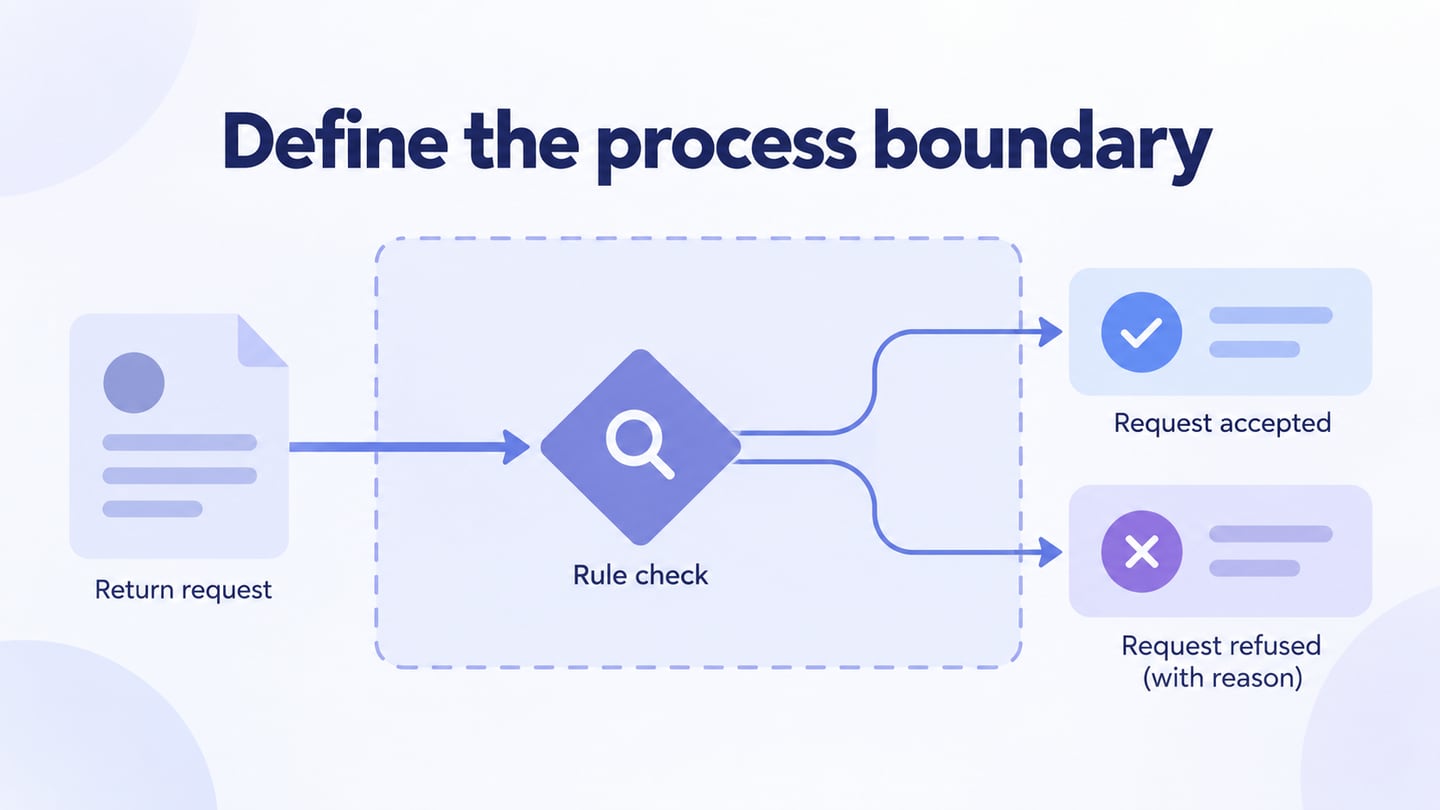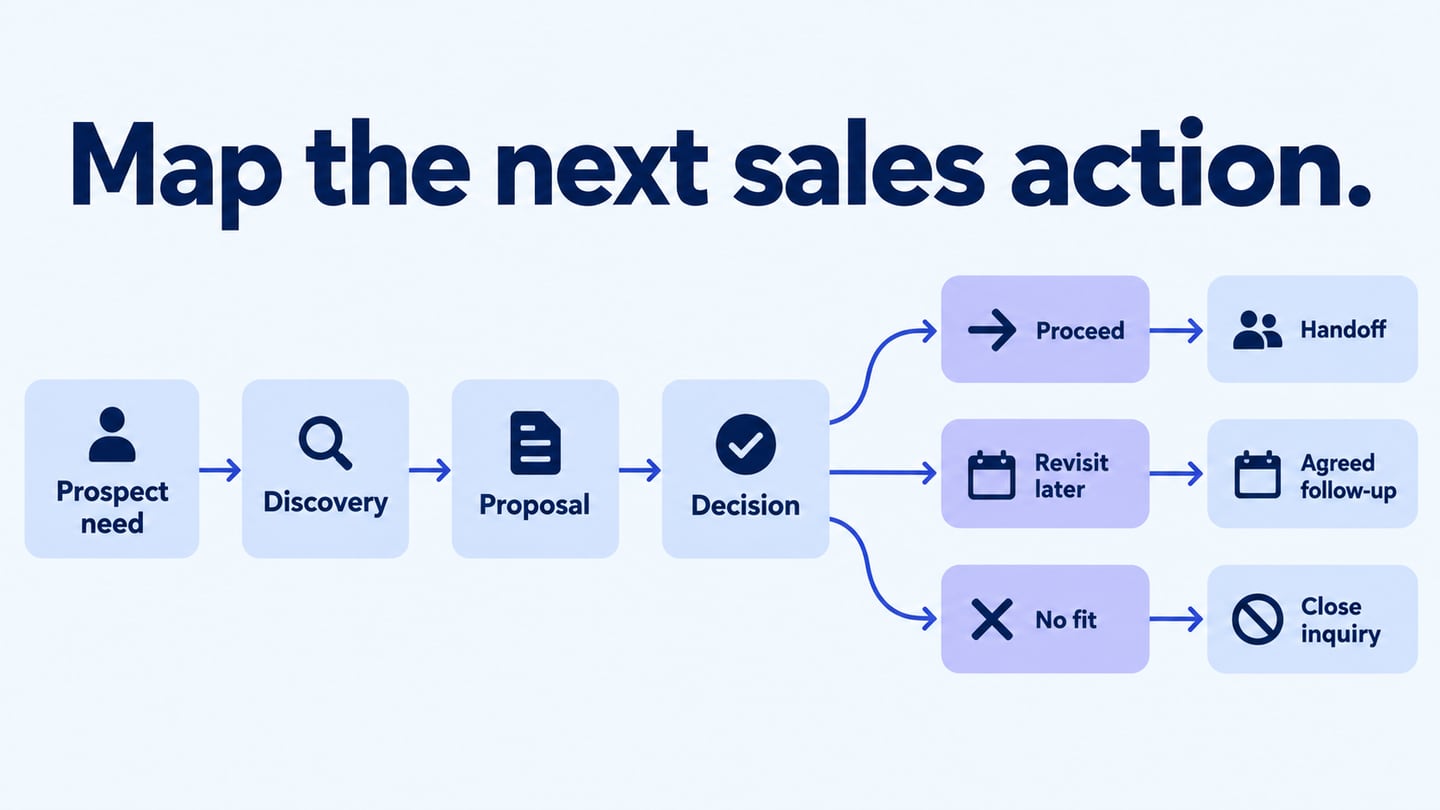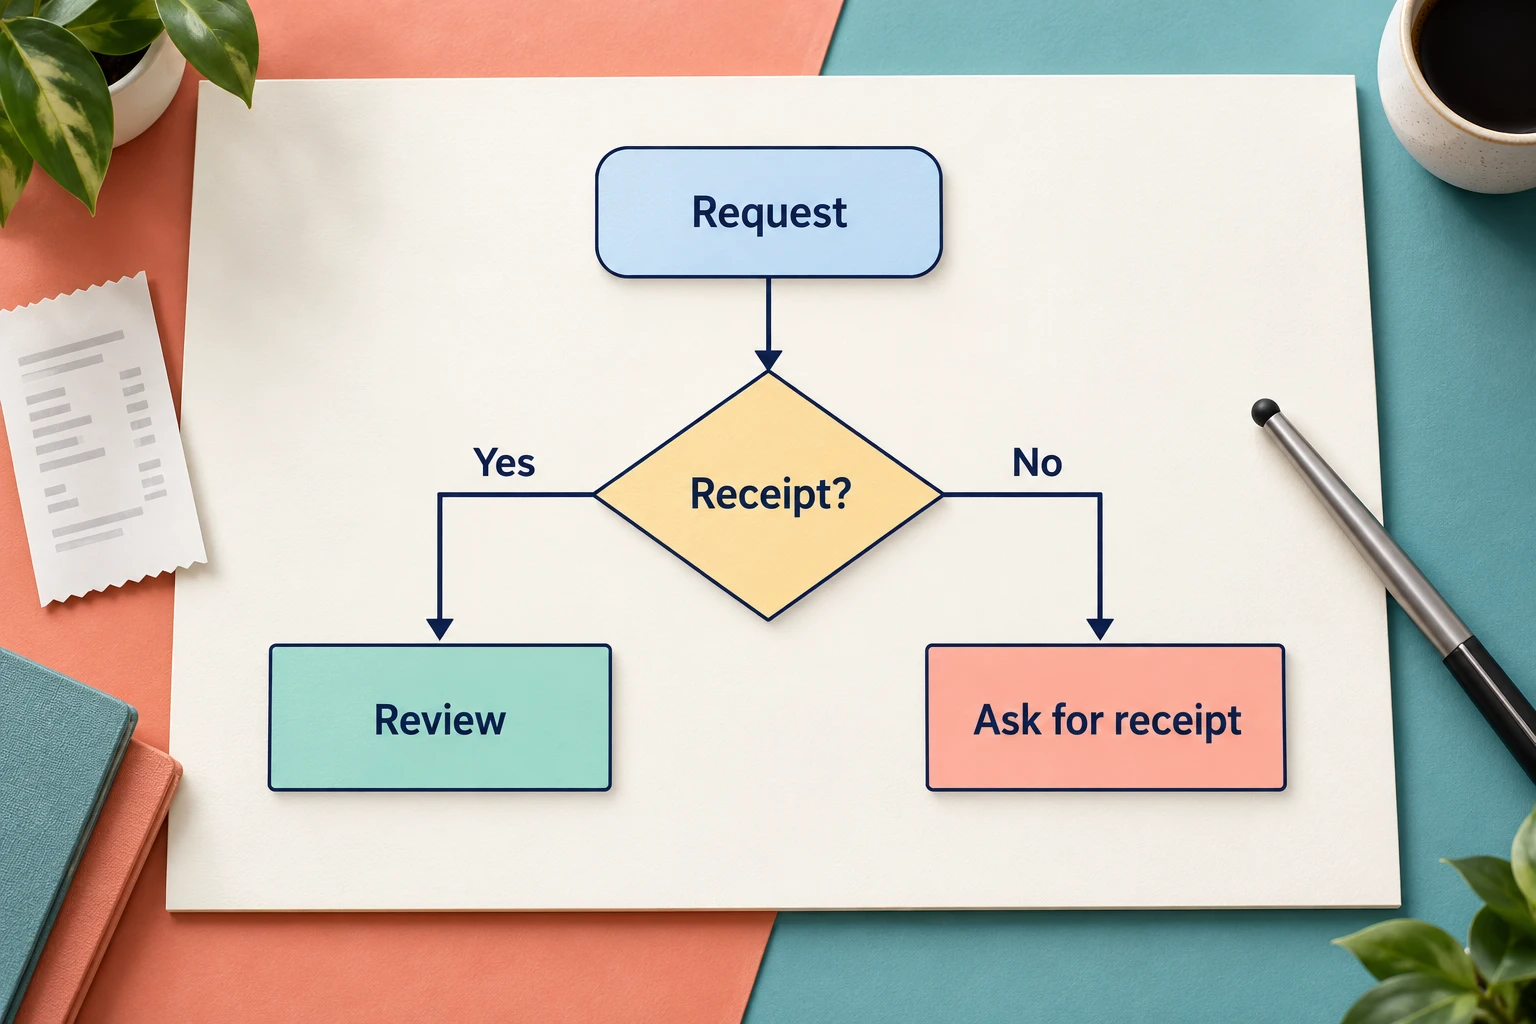
To make a flowchart in PowerPoint, insert flowchart shapes, connect them with attached arrow connectors, and label each decision branch. Use SmartArt for a short sequence with a fixed layout; use individual shapes when the process contains decisions, loops, or exceptions. This guide builds a refund-request example so you can see where each step belongs.
PowerPoint is useful when the final diagram belongs in a presentation. If the process needs a shared working canvas before it becomes a slide, Mockitt's online flowchart maker lets you arrange shapes, connect steps, and share the diagram for review. The example below works in either setting; the important part is making both outcomes of a decision explicit.
How to Create a Flowchart in PowerPoint
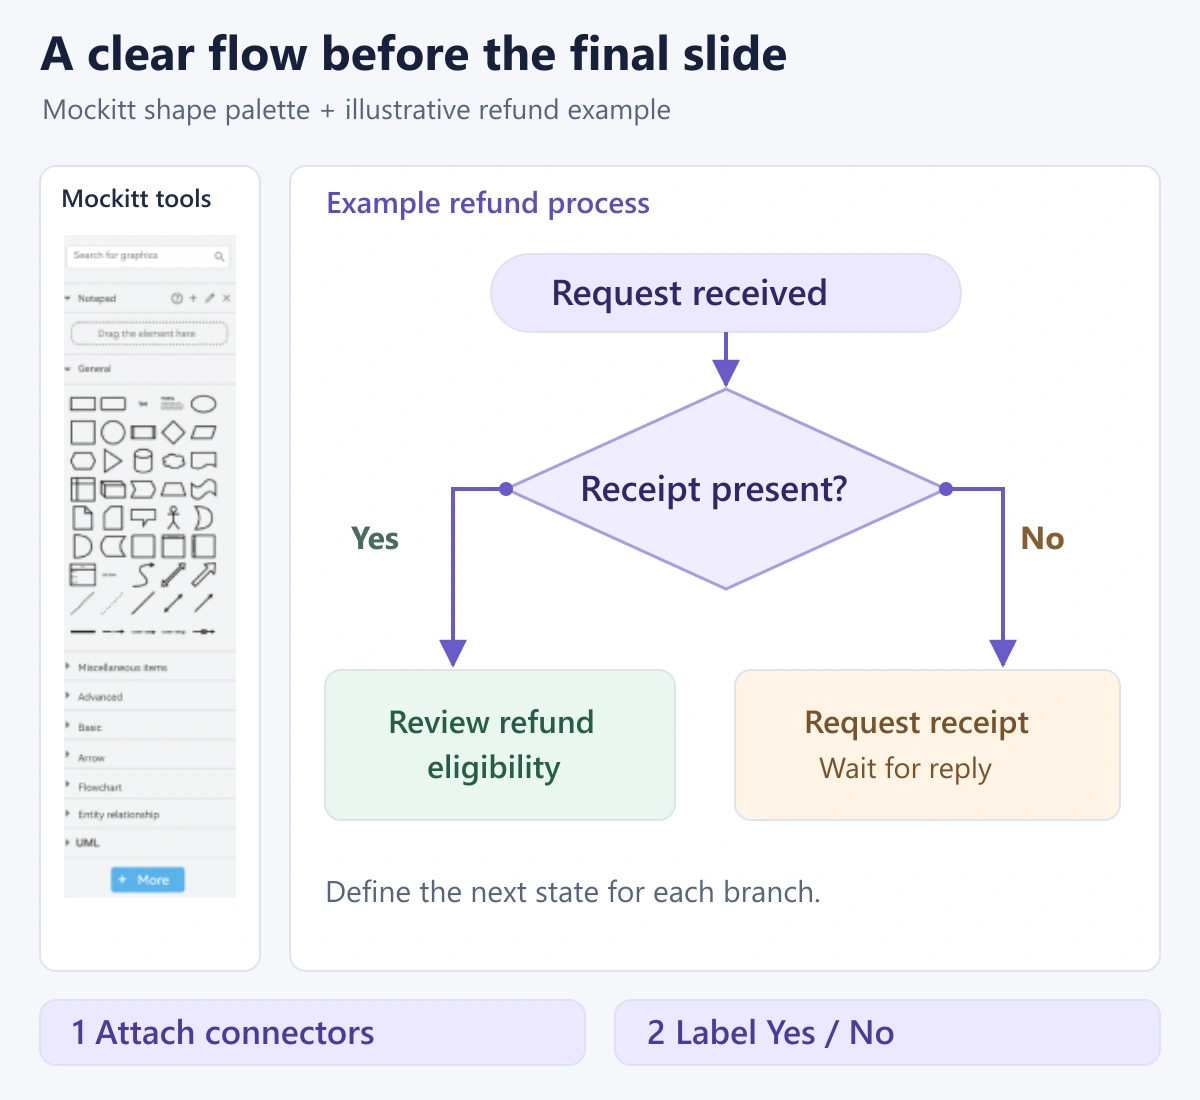
Before drawing, write down the start, the decision, and the end. For a simple refund request, use this sequence: Request received → Check request → Receipt present? A Yes branch leads to Review refund eligibility; a No branch leads to Request receipt. This is a teaching example, so replace the eligibility rules with your organization's actual policy.
1. Choose SmartArt or individual shapes
For a short sequence without branching, choose Insert → SmartArt → Process, select a layout, and replace its placeholder text. Microsoft's SmartArt flowchart instructions explain how to add the graphic and change its appearance. SmartArt is convenient when you want the diagram to follow a consistent predefined arrangement.
Use Insert → Shapes for the refund example because its Yes and No paths need separate destinations. Mixing a complex decision tree into a linear SmartArt layout usually makes the relationship harder to follow. You do not need a different box for every sentence: a shape should represent one meaningful action or decision.
2. Set up the slide and turn on gridlines
Start with a blank slide so a title or content placeholder does not compete with the diagram. Leave space at the top for a short process title and at the sides for branches. In the desktop interface, open View and enable Gridlines in the Show group. The grid helps you place and align shapes; it is not part of the final process diagram.
Choose one direction, such as top to bottom, before you add the shapes. Place the main route in the center and reserve a side lane for the missing-receipt route. This small layout decision prevents connectors from crossing labels later. If the diagram needs very small text to fit, split the process across slides rather than shrinking everything.
3. Add and label the flowchart shapes
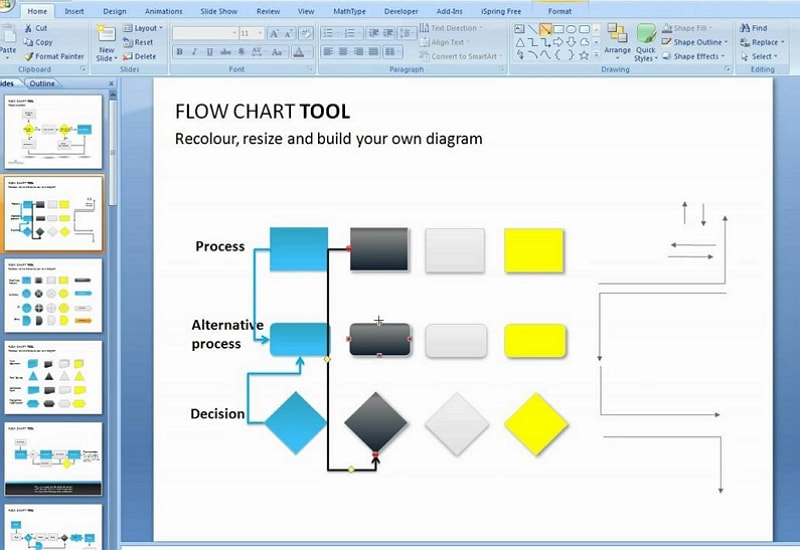
From Insert → Shapes, use the Flowchart group to choose the symbols. Drag on the slide to size a shape, type its label, and use the Shape Format controls to adjust its fill, outline, and text. Keep similar actions the same size so visual differences communicate meaning instead of accidental formatting.
- Terminator: mark the start, “Request received,” and a clear end such as “Customer notified.”
- Process rectangle: name an action, such as “Check request” or “Request receipt.”
- Decision diamond: ask a question with labeled outcomes, such as “Receipt present?”
Add “Review refund eligibility” after the Yes branch. For the No branch, decide what really happens next: does the process wait for a reply, close after a deadline, or return to the receipt check when a document arrives? Draw that behavior explicitly. A line that simply disappears off the slide leaves an important business rule unanswered.
4. Attach connectors and label the branches
Open the Lines section of the Shapes menu and select a connector with the direction you need. Start at a connection point on the first shape and finish at a connection point on the next shape. A connector attached at both ends follows the shapes when they move; a loose line that only looks attached can remain behind.
Microsoft distinguishes connectors from freeform lines and scribbles in its line and connector guide. After connecting two boxes, move one slightly and check that the line remains attached. Then add a short Yes or No label beside each outgoing decision connector. Put the label close enough that readers do not have to guess which branch it describes.
For the refund example, the No path can run to “Request receipt,” then “Receipt received?” A Yes returns to the eligibility review; a No ends at the waiting or closure state defined by the policy. Only add this second decision if it reflects the process you are explaining. A simpler slide can show the request step and reference a separate follow-up process.
5. Align the diagram and read it as a presentation
Select related shapes and use the alignment controls in Shape Format to line them up and distribute spacing. Give connectors room to bend without passing through a box. Use one arrow style, a small number of colors, and enough contrast for the labels. Color can group stages, but the labels and arrows should still explain the flow without it.
Open Slide Show and follow the process from its start. Read both branches aloud: what does the person do, what information is needed, and where does the path end? Check that text is readable at presentation size and that no branch points to the wrong box. Save the editable presentation so future changes can be made to the shapes rather than to a flattened image.
Create a Flowchart with an Online Alternative
A slide is a useful final deliverable, but it can become crowded while a team is still discussing the process. Mockitt and Boardmix provide different ways to keep the working diagram available during that discussion. Choose based on where the review happens and what needs to remain editable.
Build the process in Mockitt
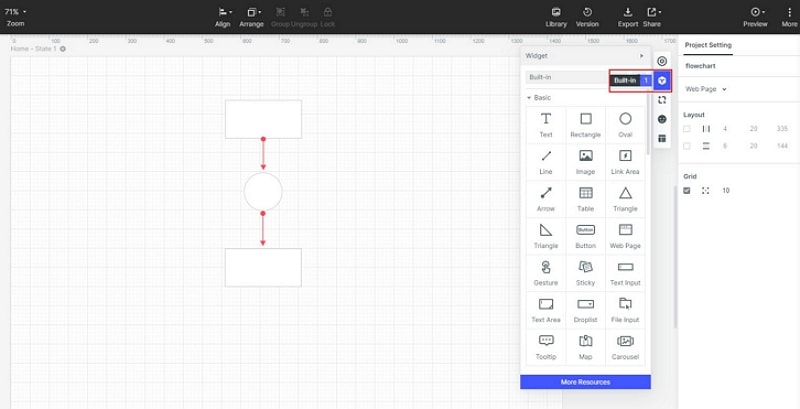
Mockitt's diagram workspace supports flowchart shapes and connectors, alignment tools, sharing, and image export. Use it to work on the process itself before placing a finished view in a deck. The refund example follows the same sequence as the PowerPoint version:
- Start a diagram. Choose a blank flowchart or a suitable template, then name the process clearly.
- Place the main steps. Add the start, action rectangles, and receipt decision. Keep enough space for both outgoing paths.
- Connect the branches. Label Yes and No, then add the missing-receipt follow-up and its end state.
- Review the handoffs. Share the diagram with the people who receive requests and check receipts. Ask them to identify missing actions or ambiguous ownership.
- Prepare the presentation. Once the process is agreed, export a PNG and insert it into your slide. Keep the working diagram for later edits.
The exported image is a visual copy, not a set of editable PowerPoint flowchart shapes. If the presenter needs to rearrange individual boxes inside PowerPoint, build those boxes in PowerPoint. If the process is maintained in Mockitt, update the working diagram and replace the slide image when the process changes.
Use Boardmix for a process workshop
Boardmix is a collaborative online whiteboard with flowcharts, sticky notes, comments, and shared editing. It is useful when the diagram needs to sit beside questions, supporting material, or decisions from a workshop. For the refund example, participants can keep unresolved policy questions next to the relevant branch while agreeing on the final route.
Keep the finished flowchart visually separate from the discussion notes so the audience can identify the actual process. PowerPoint suits a diagram edited as part of a slide deck; Mockitt suits a diagram maintained in a dedicated diagram workspace; Boardmix suits a broader shared workshop. In each case, the result should have readable steps, explicit branch outcomes, and a clear end—not simply more shapes.