A programming flowchart represents an algorithm with agreed shapes for actions, decisions, input and output. Consistent notation helps another person trace the logic before it is translated into code.
The arrows show execution order; a decision creates alternative paths, and a loop returns to an earlier step under a stated condition. A diagram can expose missing cases, but it does not prove that an implementation is bug-free.
Below are the basic symbols, a simple-interest example and four diagram tools. If you want to draft the logic visually, Mockitt Diagram provides shapes and connectors in a browser workspace.
- Part 1: What is a Flowchart in Programming?
- Part 2: Flowchart programming examples
- Part 3: Four tools for programming flowcharts
- Part 4: Create a simple flowchart online
What is a Flowchart in Programming?
Programmers use flowcharts to explain an algorithm, inspect a branch or discuss an error path. The same logic can later be expressed in different programming languages.
Use a small set of symbols consistently, and include a legend when your team uses a different convention.
- Terminal: An oval or rounded terminator marks the start or end of the algorithm. Label the endpoint clearly.
- Input/Output: A parallelogram represents data entering or leaving the algorithm, such as reading a value or displaying a result.
- Process: A rectangle represents an action or calculation, such as assigning a value or computing a total.
- Decision: A diamond tests a condition. Label its outgoing paths, for example True and False, so the next step is unambiguous.
- Connector: A labeled connector can join separated parts of a diagram. Match the labels and preserve the direction of flow; a circle is not a replacement for an unexplained jump.
Flowchart programming examples
The example below describes simple-interest calculation. It is a language-independent algorithm that could be implemented in C, C++ or Java; drawing it does not generate, execute or verify the code.
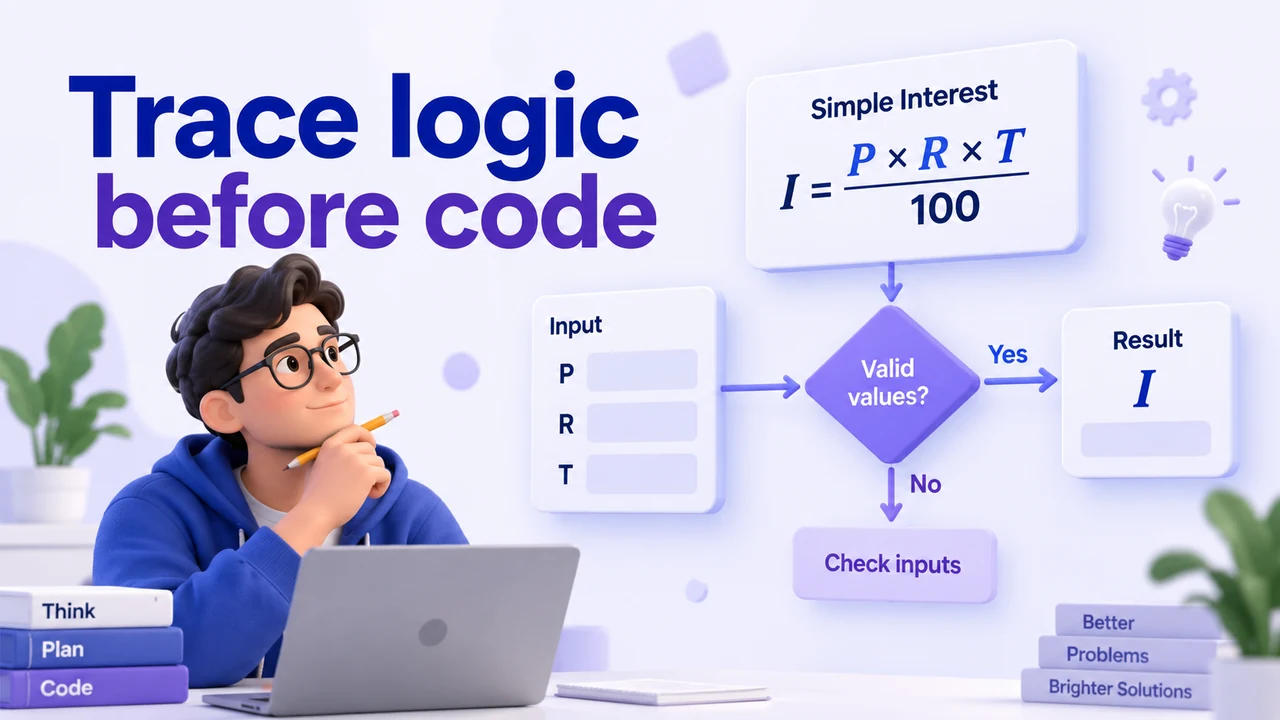
Given principal P, an annual percentage rate R and time T in years, simple interest is I = P × R × T / 100. The rate is an input, not the value being calculated. This classroom example omits compounding, fees and other loan terms.
The basic sequence is: start, read P/R/T, calculate I, output I and end. For example, P = 1,000, R = 5 and T = 2 gives I = 100. A fuller implementation should define how invalid or missing inputs are handled.
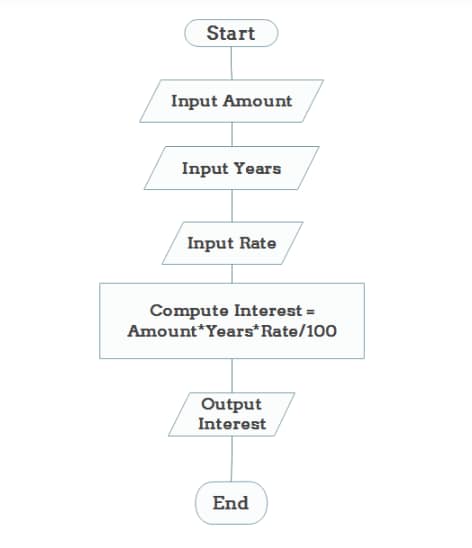
Trace the algorithm with a normal input and an invalid input before writing code. Check that every branch reaches a defined endpoint or returns under an explicit loop condition, then test the actual implementation separately.
Four tools for drawing programming flowcharts
The tools below draw diagrams rather than execute the algorithm. Choose around how you want to edit, discuss and maintain the logic.
Start with the simple-interest sequence, then add an invalid-input branch. The useful comparison is whether another person can follow both paths and revise the chart without losing its meaning.
1. Mockitt: visual algorithm discussion
Mockitt Diagram provides shapes, connectors, templates and alignment tools. Use separate input, calculation, decision and output shapes so a reviewer can distinguish data from control flow.
For the interest example, add an explicit validation condition before the calculation if that is part of your intended algorithm. The diagram documents the decision; it does not enforce input validation in the eventual program.
2. Boardmix: trace logic together on a whiteboard
Boardmix combines flowchart tools with notes, comments and collaborative editing. Keep sample inputs beside the diagram so a reviewer can trace the same values through each step.
Separate the algorithm from questions about the implementation. Resolve a missing branch in the flow before using it to explain the code, and check board access and size limits for the intended team.
3. Zen Flowchart: a focused node-and-connector editor
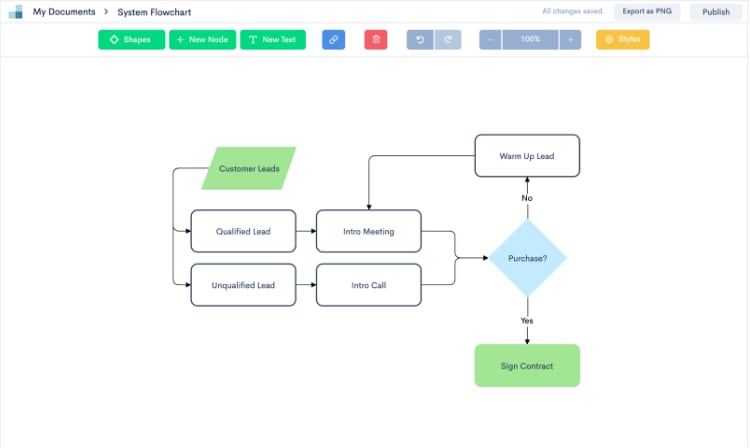
Zen Flowchart provides a focused flowchart editor with nodes, connectors and templates. It is an option for a small algorithm where the main task is arranging and labeling the logic.
Check the current sharing and export requirements with your example. A tidy node layout does not remove the need to trace conditions and loops.
4. Visual Paradigm Online: flowcharts alongside technical diagrams
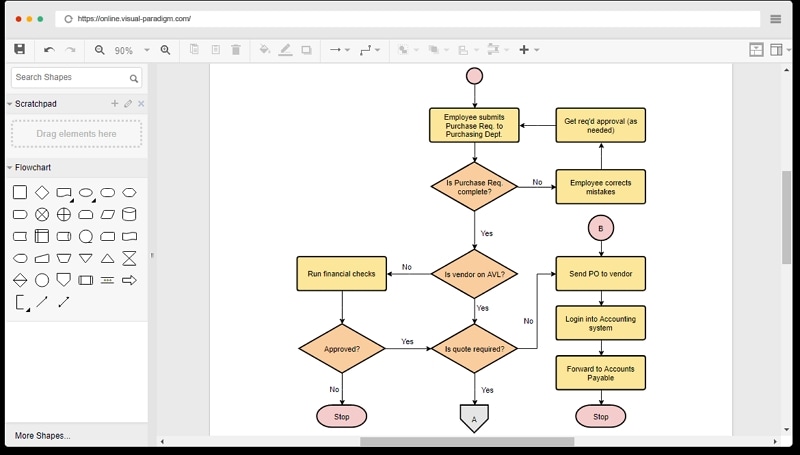
Visual Paradigm Online offers a browser flowchart editor, alignment guides, templates and collaboration. Its other technical diagram types can be useful when the algorithm is documented alongside a larger system.
Choose the required edition and output format, and keep the editable diagram. Do not assume that every feature or integration is included in a free account.
Create a simple flowchart online
To draft the algorithm in Mockitt, start with the input and output requirements, then place the calculation between them. Add a decision only when it represents a real condition in the algorithm.
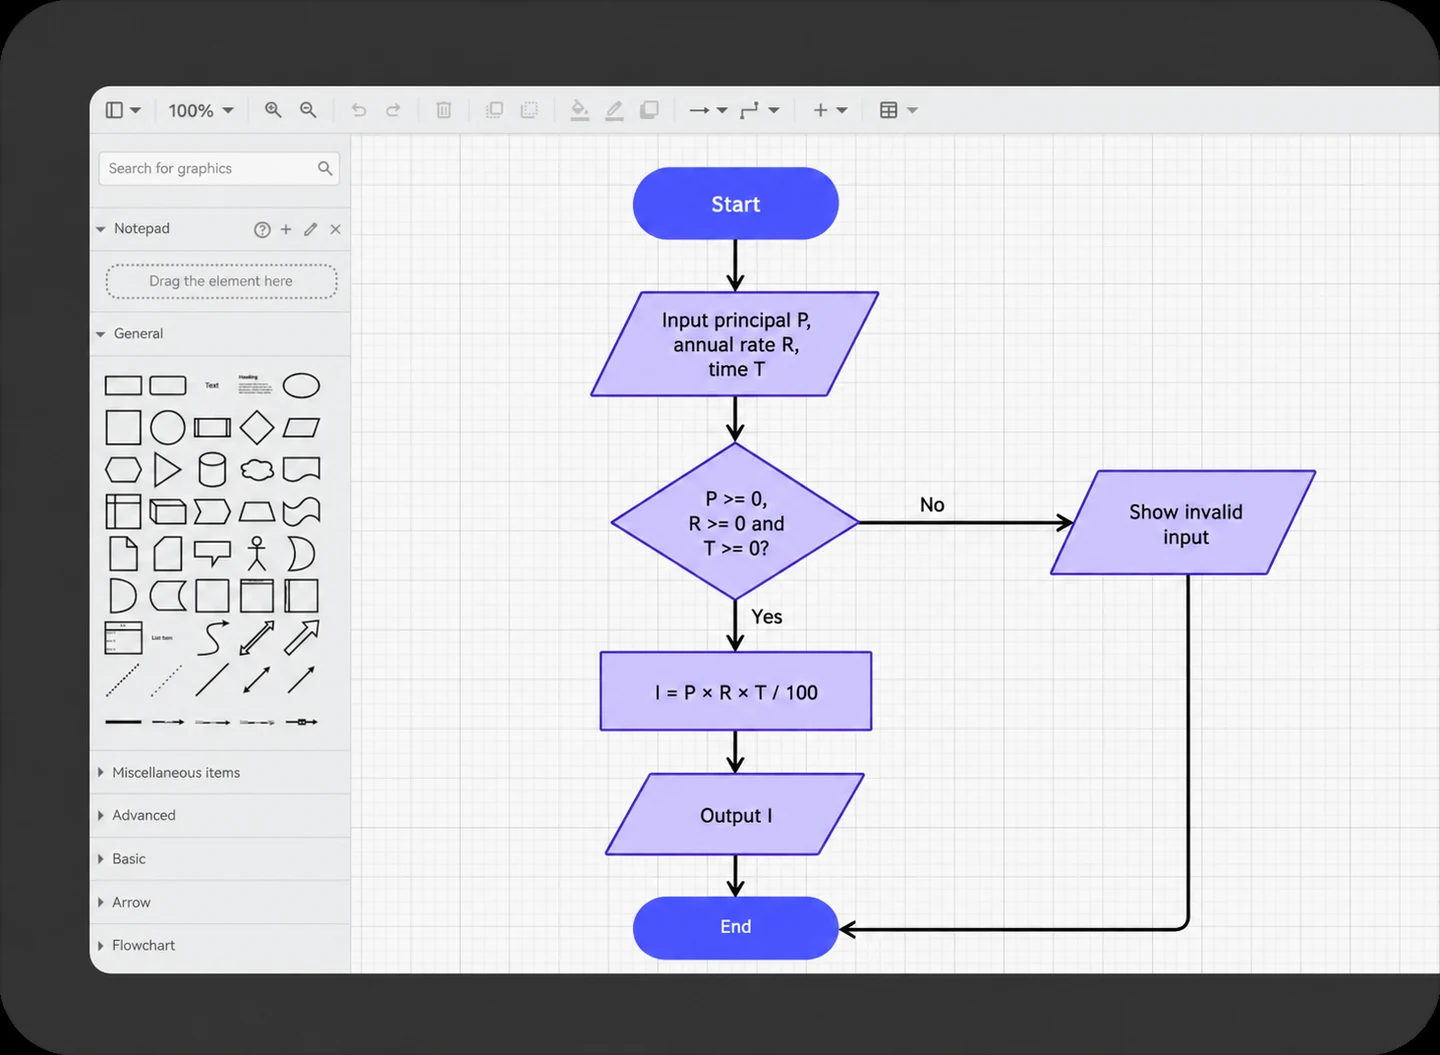
Connect each path and label its condition. Avoid unexplained jumps or branches that end without an outcome.
Trace the example values through the diagram with a reviewer, then check another case that exercises a different branch. Save the editable chart so corrections remain possible.
Use the reviewed diagram as a specification aid. The implementation still needs its own tests for arithmetic, input handling and other behavior that a picture cannot verify.