Exploratory data analysis (EDA) is the work of inspecting a dataset before treating its patterns as reliable evidence. In a product project, that can mean checking the units, missing values, unusual sessions, and differences between device groups before proposing a design change. It complements a broader research data-analysis workflow; it does not turn a correlation into a cause or guarantee a successful product decision.
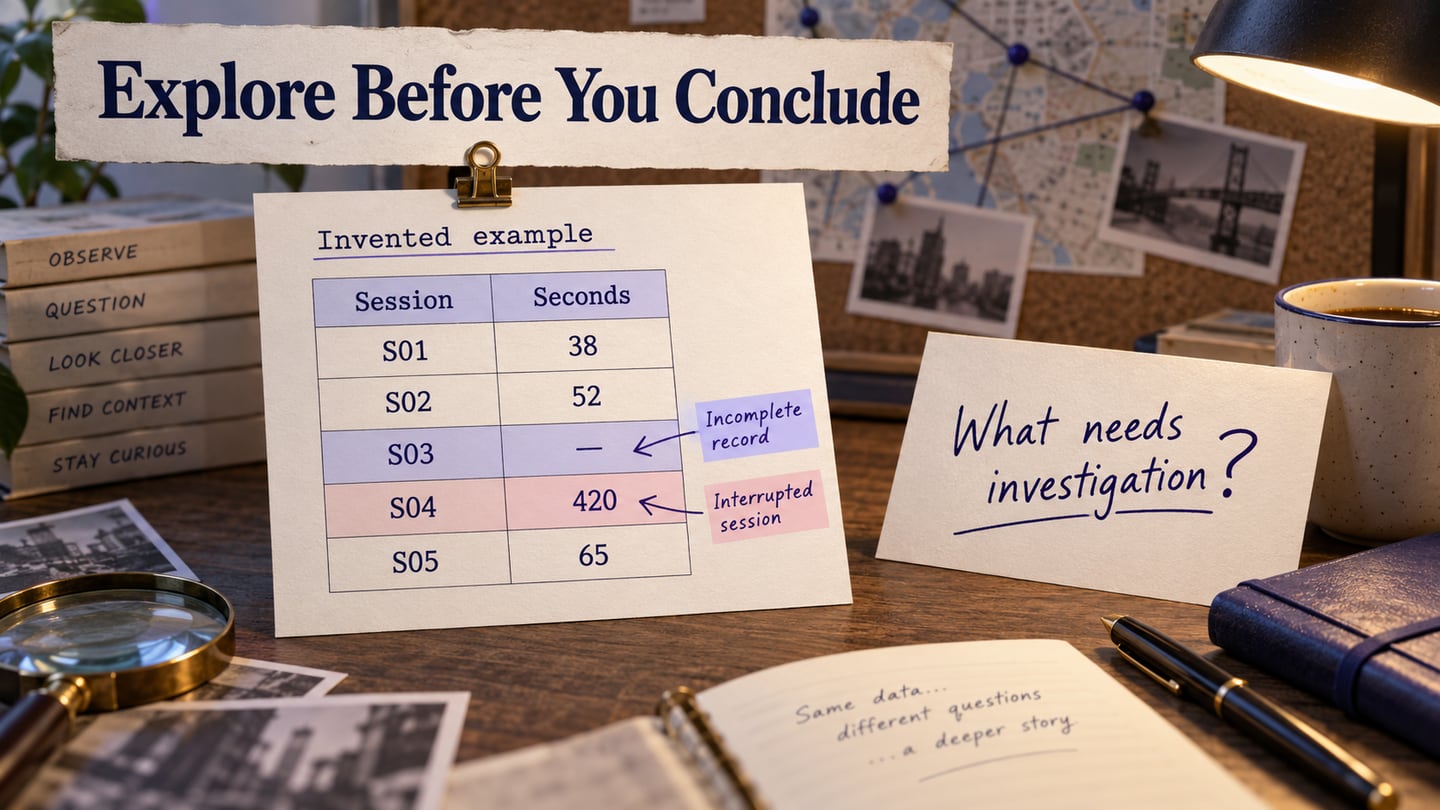
Consider an illustrative set of search-task sessions. One session has no recorded duration, another lasts much longer because it was interrupted, and mobile and desktop sessions may have different conditions. Those details should be investigated before calculating a single “average time” and deciding that the interface is slow.
The following five records are invented to demonstrate inspection decisions, not collected study results. A dash means unknown, not zero.
| Session | Device | Status | Seconds | Collection note |
|---|---|---|---|---|
| S01 | Desktop | Completed | 38 | No pause noted |
| S02 | Mobile | Completed | 52 | No pause noted |
| S03 | Mobile | Unknown | — | Recording incomplete |
| S04 | Desktop | Completed | 420 | Session interrupted |
| S05 | Mobile | Not completed | 65 | Participant stopped early |
Check S03 against the source record before deciding whether it can be analyzed. Keep S04 identifiable while investigating the interruption, and do not pool S05 with completed-task times without explaining the different outcome. These records are too small and conditional to support a claim that one device group performs better.
What is exploratory data analysis?
NIST describes EDA as an approach that uses analysis and graphical techniques to reveal structure, identify unusual observations, and examine assumptions. Python is one possible tool, not a requirement. A spreadsheet, statistical package, or suitable programming environment can support the work. Descriptive analysis summarizes what is in the data; EDA uses summaries and plots to investigate what deserves closer attention.
Why Is Exploratory Data Analysis Important?
EDA helps you decide whether the data can support the next question. It is useful for:
- Understanding which variables exist, what they measure, and the units or categories they use.
- Checking the amount and pattern of missing data before choosing how to handle it.
- Finding unusual observations and investigating whether they are errors, special cases, or valid variation.
- Comparing distributions and relationships instead of relying on one summary number.
- Recording questions and assumptions that require follow-up, further research, or a more formal analysis.
How to do exploratory data analysis?
The following seven activities help you understand, clean, and prepare a dataset. They are an iterative workflow, not a compulsory recipe for building a predictive model. Keep a copy of the original data and a record of each decision.

- 1. Identify variables: Define each field, unit, and category. For search sessions, that might include session ID, device group, completion status, and duration in seconds. Distinguish a missing value from a genuine zero. If there is a specific outcome to model, name it; exploratory work does not always start with a prediction target.
- 2. Inspect one variable at a time: Count categories and inspect the distribution of numeric values. Look at completion statuses separately from durations. A histogram, dot plot, or frequency table may show a cluster or long tail that an average obscures. Check that categories such as “mobile” and “Mobile” have not been treated as different groups.
- 3. Compare pairs of variables: Examine relationships that match a real question, such as duration by device group. Choose a suitable chart or table for the types of variables. A difference between groups is not proof that the device or interface caused it; task difficulty, participant experience, or collection conditions may also differ.
- 4. Investigate missing values: Count what is missing and where. In the illustrative search dataset, a blank duration could mean an interrupted recording, a failed task, or a logging issue. Do not silently replace it with zero. Choose exclusion, correction, or another treatment only after understanding the reason, and report the decision.
- 5. Investigate unusual observations: A very long session could reflect a difficult task, a pause, or a measurement error. Check the source record before removing it. Compare the analysis with and without the observation when that helps explain its influence; do not delete a valid case merely because it weakens the result you hoped to see.
- 6. Consider transformations: A transformation changes how a variable is represented, for example by using a logarithmic scale to inspect positive values spanning a wide range. Explain the reason and keep the original units available for interpretation. A transformation is not a substitute for correcting an invalid measurement.
- 7. Derive useful variables: Create a new field only when it answers a meaningful question. A timestamp might yield day of week, or a session status might identify completed tasks. Document the rule, check time zones where relevant, and avoid deriving a predictor from information that would only be known after the outcome.
Revisit earlier steps when a plot exposes a data-quality problem or a new question. Finish with a short record of what you observed, what remains uncertain, and what analysis or research should follow. NIST’s collection of EDA techniques is a useful reference when choosing a graphical check.
Software for UX
Mockitt can help communicate a design hypothesis after analysis; it is not the statistical engine that performs EDA. For example, a confusing result filter may be worth investigating, but the data alone may not explain the difficulty. A prototype gives the team something specific to discuss and evaluate in a separate research activity.
For the search-task example, sketch a result list with a clearly labeled “Available now” filter and a visible filtered state. Record the hypothesis: “People may overlook the availability control.” Ask what observation would support or contradict that idea. The screen below is an illustrative proposal, not a measured improvement or an analytics dashboard.
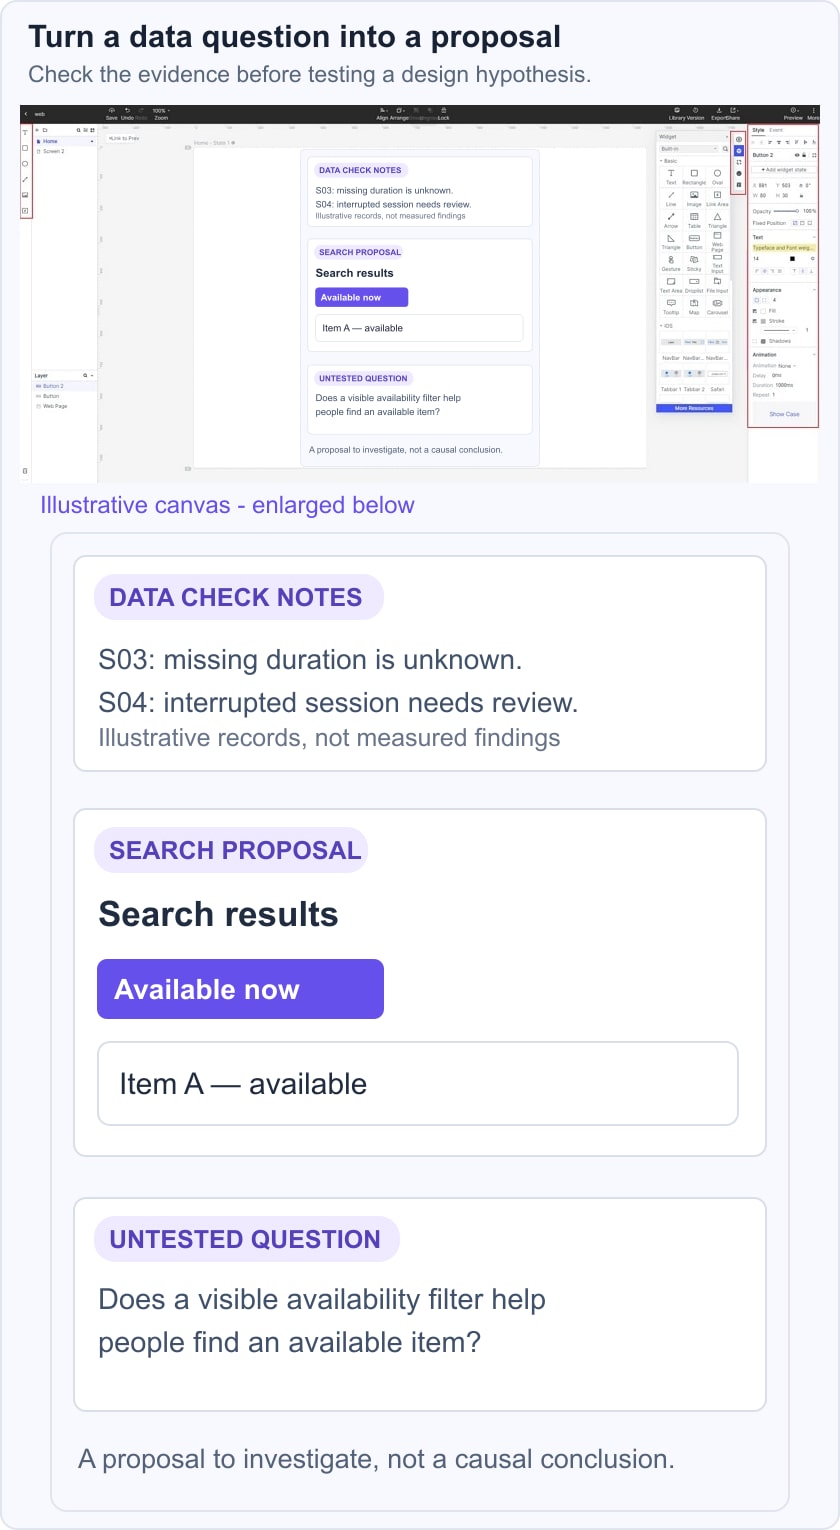
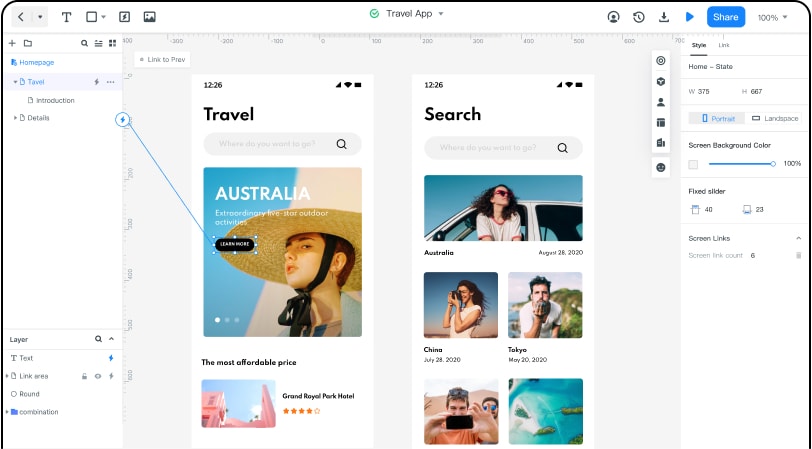
- Prototyping: Use a connected screen prototype to express a proposed interface change. Keep the hypothesis separate from the evidence that led to it.
- Libraries: Reuse appropriate interface elements so the review focuses on the proposed change rather than unrelated visual variation.
- Collaboration: Invite relevant teammates to examine the screen, the question, and the assumptions. Access and review arrangements depend on the workspace.
- Feedback: Collect comments on the proposal, then plan a suitable usability or product evaluation. Team comments are not a replacement for user evidence.