Learn what the flowchart input/output symbol means, how it differs from process and decision shapes, and how to label a clear data flow.
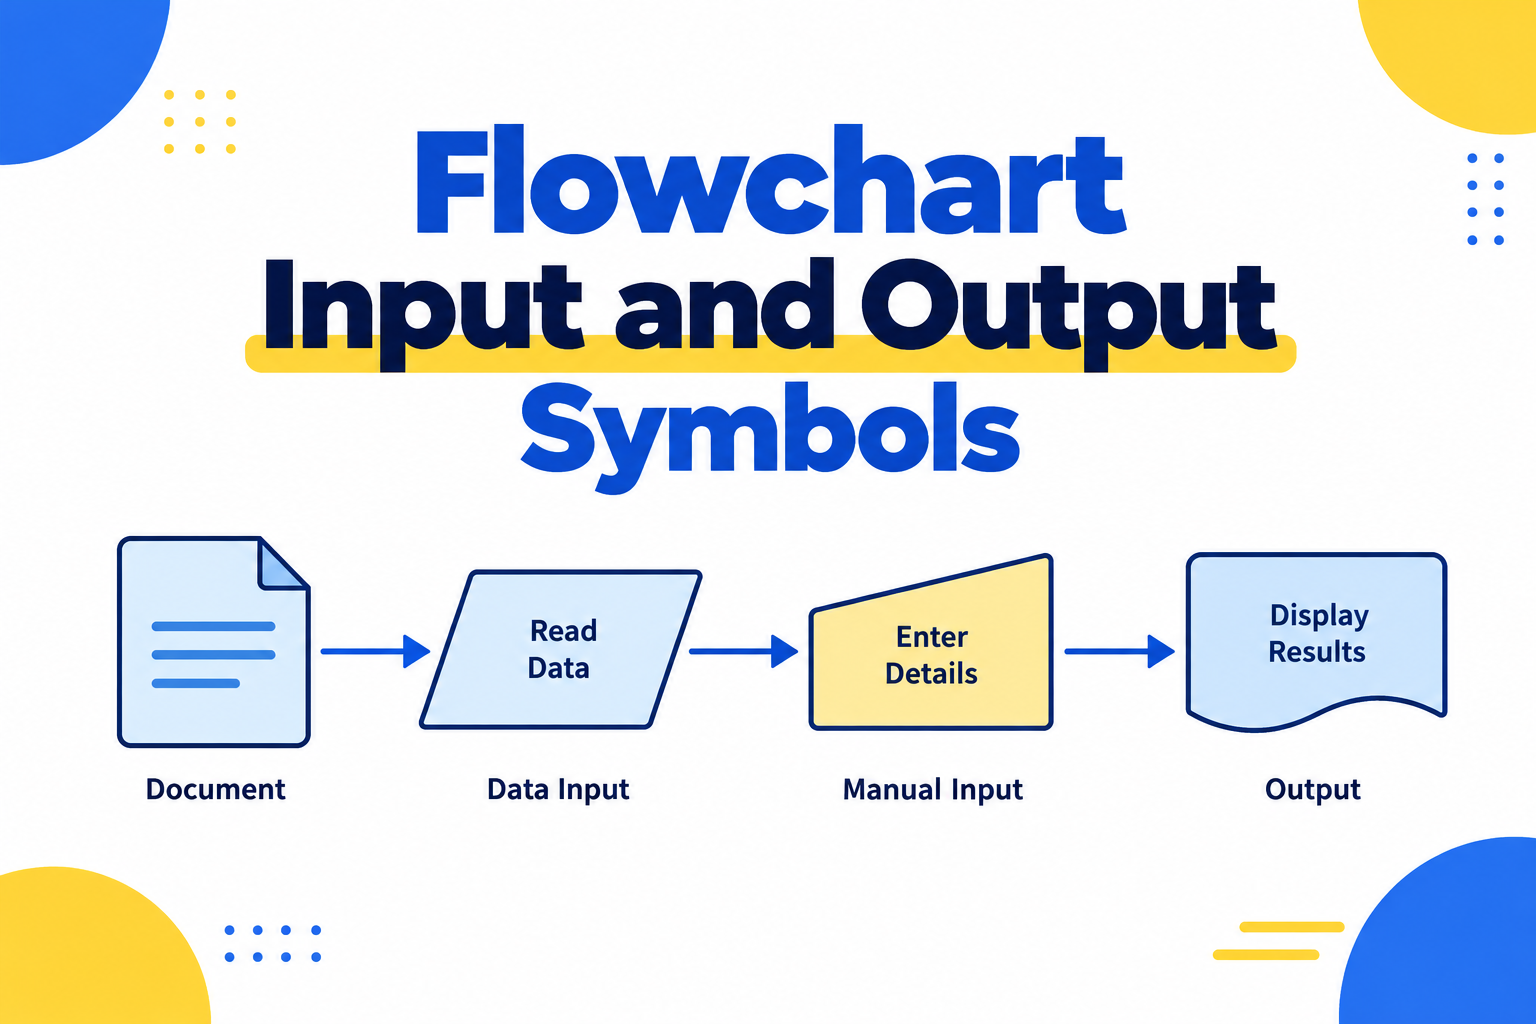
Flowcharts use a small vocabulary of shapes to show data, actions, decisions, and outcomes. The input/output symbol is often called the data symbol. It is usually drawn as a parallelogram and represents information entering or leaving a process. The shape itself does not permanently mean “input” or “output”; the surrounding labels and flow direction explain which role it has in a particular diagram.
For a practical editor, Mockitt’s online flowchart workspace lets a team arrange the steps, connect them, and review the path together. Choose the notation first, then use the tool to make the relationships visible.
What is the flowchart input/output symbol?
The data symbol marks a point where a process receives or produces information. Examples include a customer entering an email address, a system reading a file, a service returning a confirmation number, or a report being exported. A flowline arrow shows where the information moves next.
Do not confuse the data symbol with a process symbol. A process is commonly shown as a rectangle and describes an action such as “Validate address.” A decision is commonly shown as a diamond and asks a question with branches such as “Address valid?” An oval or rounded terminator often marks the start or end of a flow. Teams may use a house style or a different standard, so agree on the legend before a diagram is shared.
Input example
In an order flow, Customer details can be shown as a data symbol feeding the process Validate details. The label tells readers what the data is; the arrow shows that it enters the validation step. If the data is incomplete, the decision branch can return the person to the form with the missing field identified.
Output example
After payment is accepted, Order confirmation can be shown as a data symbol leaving the process Create order. The output might be a confirmation page, an email, or a record passed to another service. The label and the outgoing arrow communicate the result more reliably than calling the shape an “output symbol” in isolation.
Functions of the data symbol
Use the input/output symbol when the movement of information is important to understanding the procedure. It can help a reader:
- identify what a process receives before it starts;
- distinguish user-provided data from an internal action;
- show a file, message, record, or report moving between steps;
- trace what a process produces for the next step or system; and
- spot missing validation, error handling, or handoff points.
Keep labels concrete. “Payment details” tells the reader more than “Input,” while “Receipt sent” is more useful than “Output.” If one symbol contains several unrelated values, split the data or add a short note so the process remains readable.
For handoff, add a small legend when the diagram will be read by people outside the project. Record whether a data shape represents a file, a message, a user entry, or a system record, and state which notation standard the team follows. That short note prevents a familiar shape from being interpreted differently by another team.
A simple input-to-output example
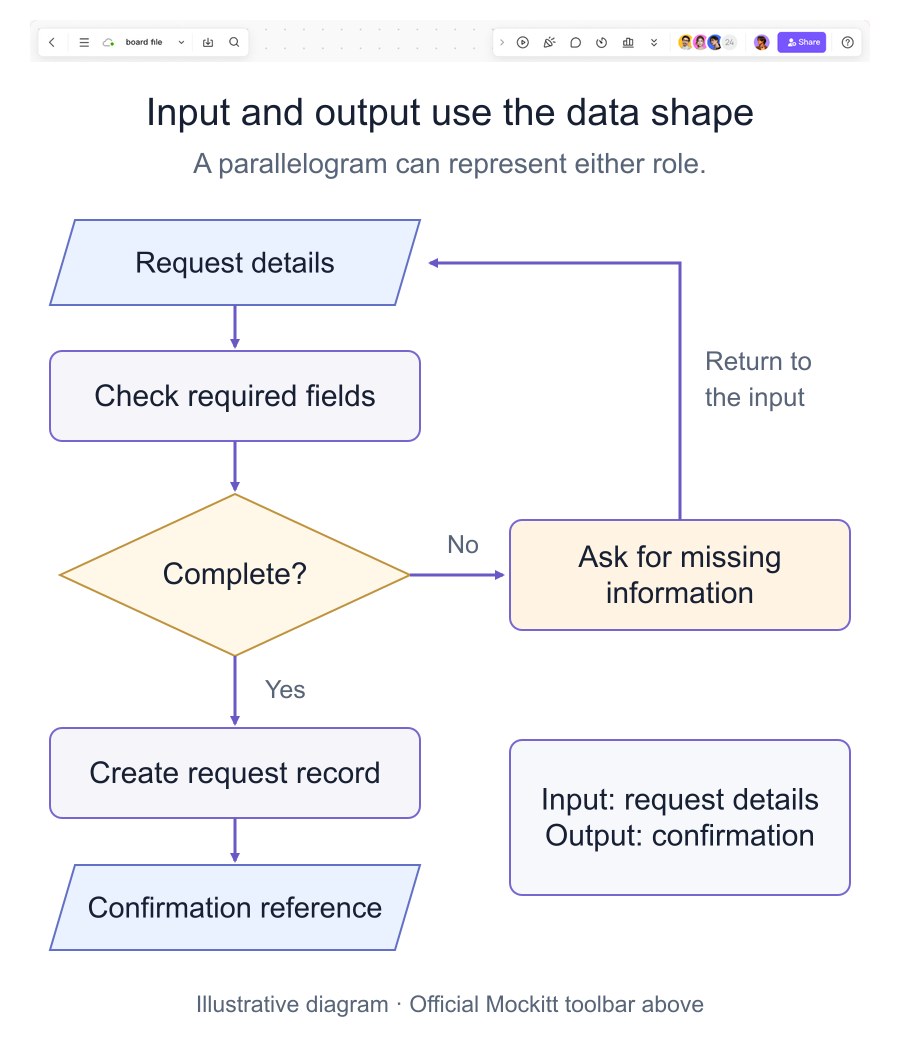
Consider a service-request flow:
- Request details — data enters the flow.
- Check required fields — a process validates the information.
- Complete? — a decision creates Yes and No branches.
- Ask for the missing field — the No path returns to the request.
- Create request record — the valid data is processed.
- Confirmation reference — the resulting record or message leaves the process.
This example makes the roles visible without forcing separate shapes for every kind of input or output. The same data symbol can appear at the beginning and end because its role is determined by the direction and context.
Creating a clear flowchart online
Build the diagram around a single task. Start with a blank canvas, arrange the symbols, and label the connections so a teammate can follow the process without an explanation.
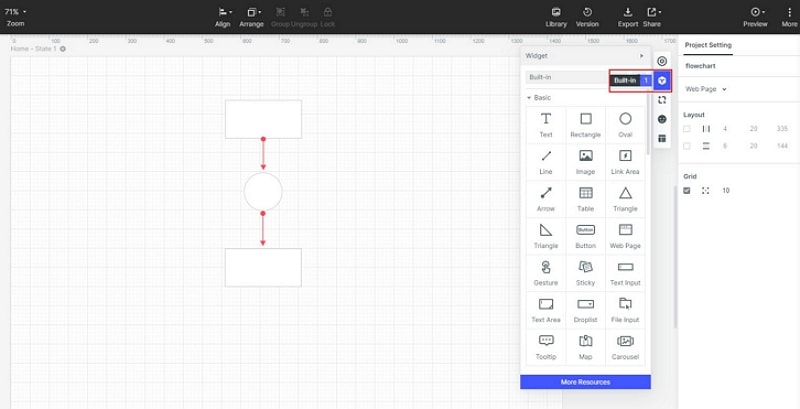
- Start a flowchart project. Open the online flowchart workspace and choose a blank canvas or a suitable starting layout. Name the flow around the task, such as “Service request validation.”
- Place the symbols. Add data, process, decision, and terminator shapes. Write a short label inside each shape and connect them with directional flowlines. Keep the main path in one direction and place alternate branches close to the decision that creates them.
- Review the states. Check the incomplete, rejected, and successful paths. Use the available style and sharing controls to make labels readable and invite a teammate to review the logic. Select an export or share option that is available in the current workspace rather than relying on an old format list.
Common mistakes to avoid
- Treating arrows as decoration instead of showing a real relationship.
- Calling every four-sided shape an input symbol without checking its role.
- Using a rectangle for data when the process itself is what needs to be described.
- Leaving a decision branch without a labelled Yes/No or equivalent outcome.
- Omitting what happens when data is missing or rejected.
- Adding unrelated internal links or broken placeholder destinations to the guide.
Conclusion
The flowchart input/output symbol is usually a parallelogram data symbol. It can represent information entering or leaving a process; arrows, labels, and the surrounding steps provide the meaning. Combine it with process, decision, and terminator shapes, then test the main and alternate paths with a real example. A clear legend and honest labels make the diagram easier to review and maintain.