
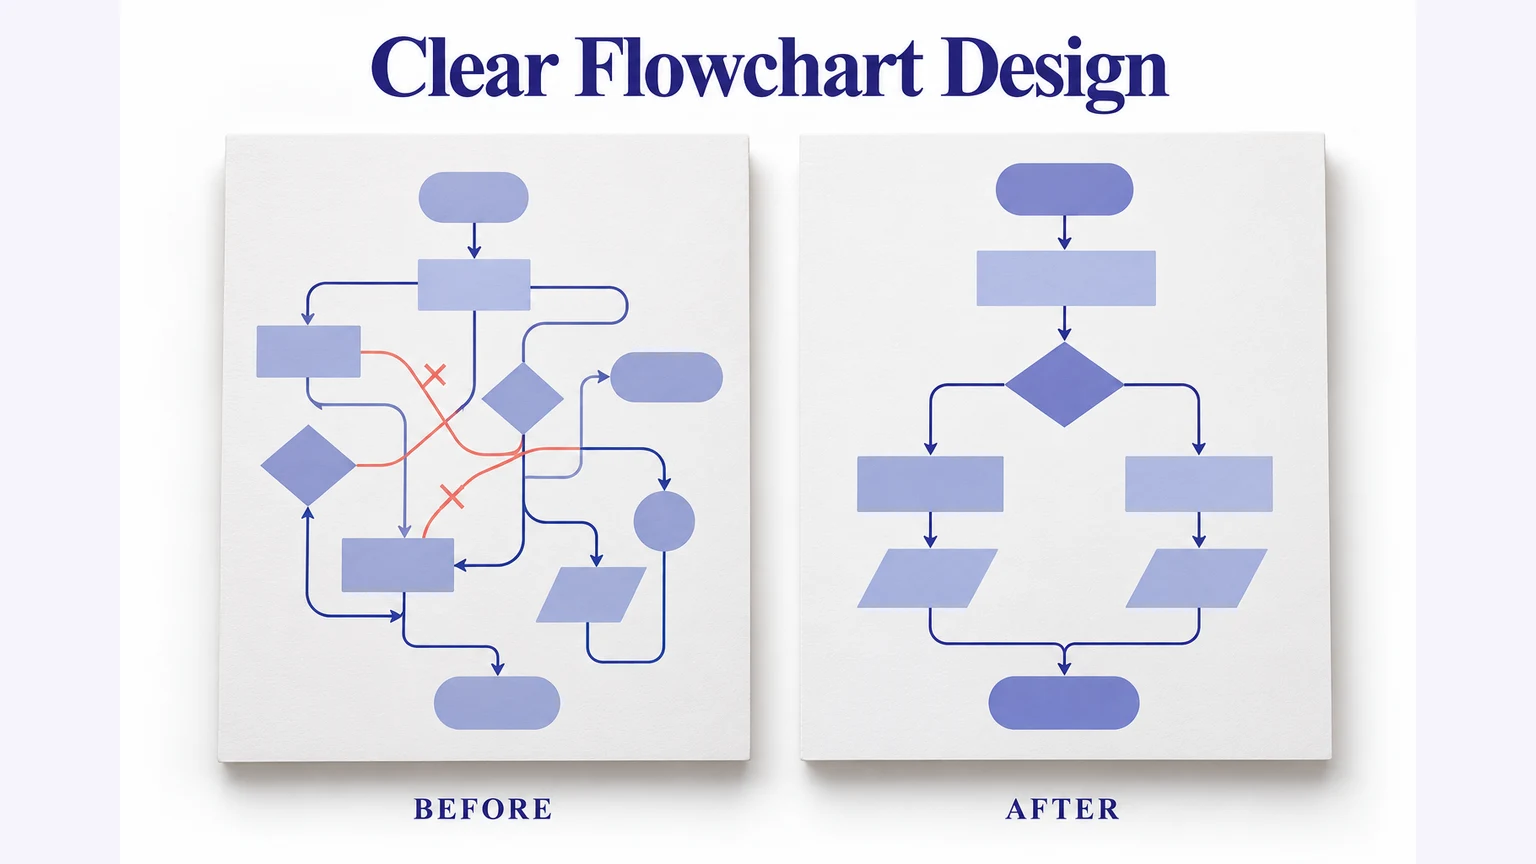
Good flowchart design makes a process easy to follow: use shapes consistently, write specific action labels, name the decision branches, and keep a clear reading direction. Once the logic is correct, improve spacing and connector routing so readers can see the next step without tracing a maze.
You can apply these principles in Mockitt’s flowchart editor. This guide focuses on making an existing process readable, from the first rough arrangement to a diagram your team can review and maintain.
A useful chart explains the process before it impresses anyone with its appearance. The worked example below improves a content-approval flow by clarifying labels and separating its return path.
What is flowchart design?
A flowchart represents actions, decisions, and their sequence. Its design is the arrangement and visual treatment that help people read those relationships. It is not simply a way to place a large amount of data in one picture.
The same process can be difficult or straightforward to read depending on how its shapes and connectors are arranged. A left-to-right or top-to-bottom sequence gives readers a starting direction; labeled branches explain where that sequence changes.
Content placement, spacing, labels, and connections work together. Put closely related actions near each other, but leave enough space for the arrow and its label. A diagram with tidy boxes can still be confusing if two unlabeled lines cross in the center.
You can pick a design from the templates or create your own style in a flowchart tool. Choose a layout that fits the logic rather than adding or deleting steps just to match a decorative design.
Here are a few things that you need to consider while creating a new flowchart design:
- Audience and purpose: decide who will read the chart and which process question it should answer. A team procedure needs more operational detail than an overview for a presentation.
- Scope and information: define the start and finish, then collect the actions and rules inside that boundary. Split a large process into linked diagrams instead of shrinking all the text.
- Reading structure: choose a sequence, branching, or lane-based arrangement. If responsibility is the main question, a swimlane flowchart can make ownership explicit.
These decisions determine how much detail belongs in the chart and which relationships deserve visual emphasis. They are more useful than choosing colors before the process is understood.
How to make a flowchart easier to read
Work from meaning to appearance. First check the route and labels; then arrange shapes, connect them cleanly, and apply a restrained visual style.
- Use a small, consistent symbol set. A process box names an action and a decision shape asks a question. Do not change shapes merely to make neighboring steps look different.
- Arrange the main route in one direction. Put an exception or a return path beside it, with enough space that its connector does not pass through another shape.
Give each action a short verb-and-object label, such as “Review draft” or “Send confirmation.” Replace “Processing” and “Handle request” with the specific action a reader is expected to take. A question such as “Draft approved?” belongs in a decision shape.
- Base the chart on the real procedure. Ask the people performing it to explain the inputs, decisions, and exceptions; do not assemble an operational process from unrelated forum questions.
Use the ASQ flowchart approach as a reminder to walk through a process with those involved. The review can reveal missing work that a visually polished drawing would otherwise hide.
After the logic review, make the labels readable at the size the chart will be used. For a wide process, a linked detail view is often clearer than forcing every step onto a single slide.
Example: improve a content-approval flow
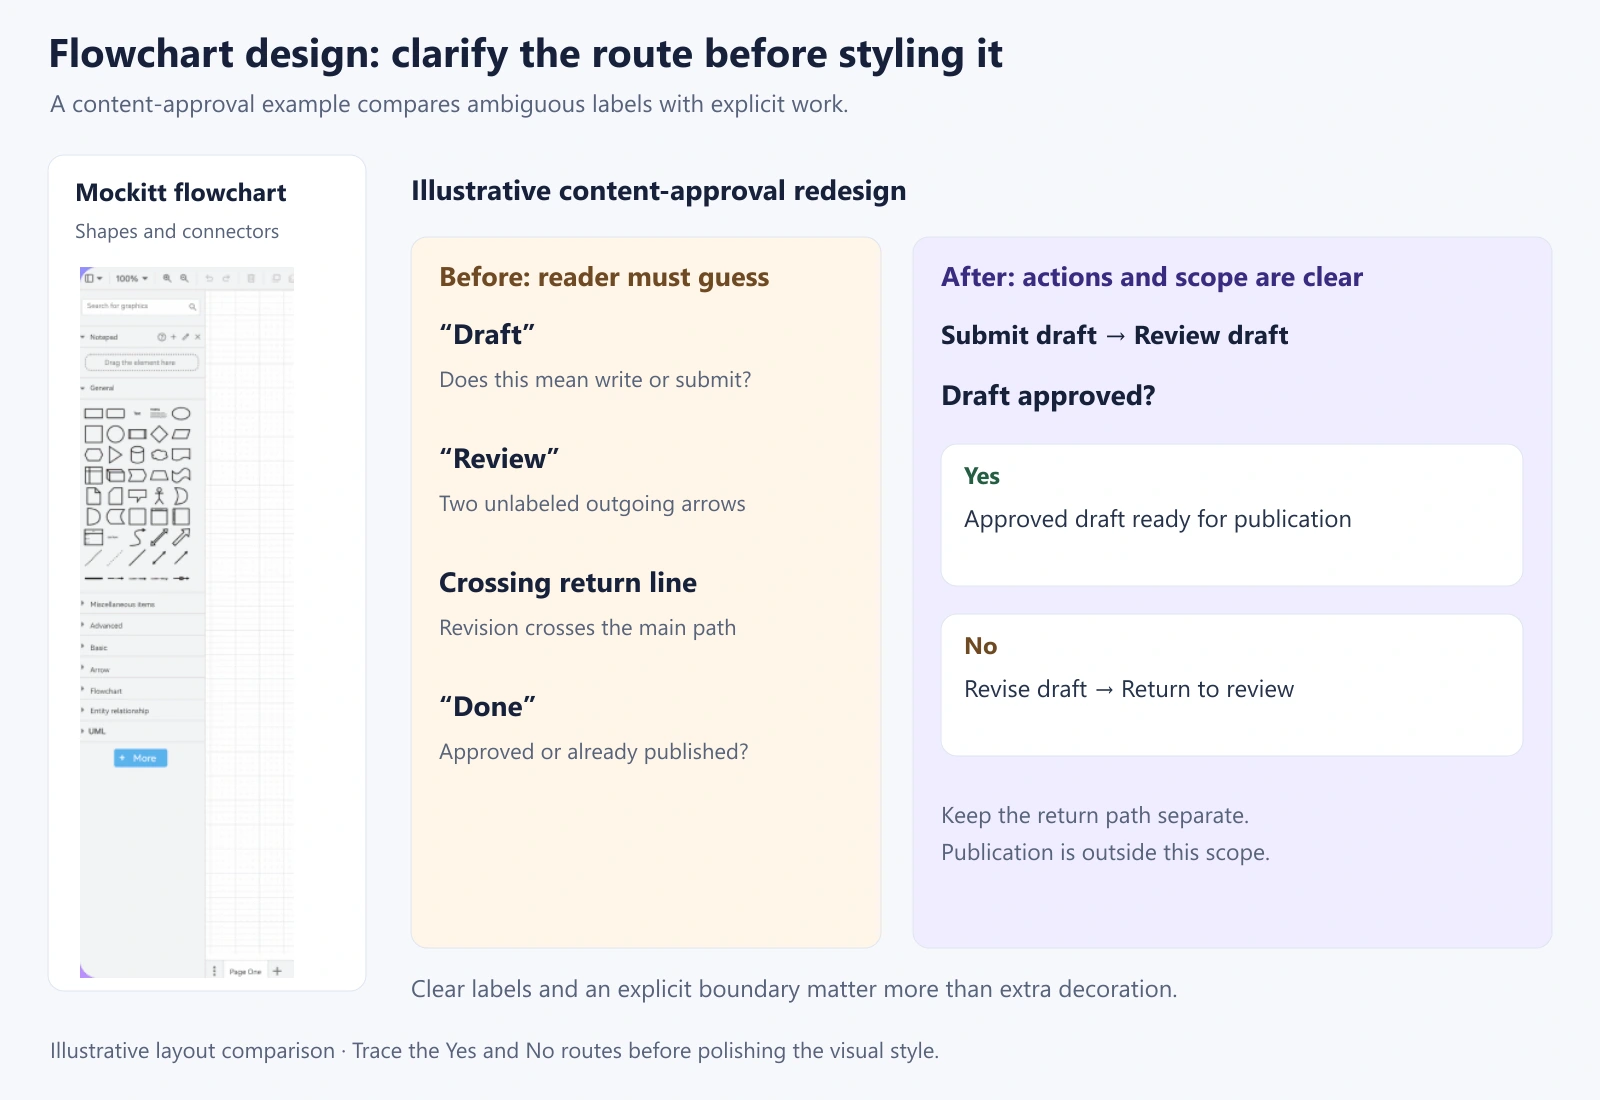
Imagine a draft moving from an author to a reviewer and then to publication. In a rough version, the boxes say “Draft,” “Review,” and “Done,” while a line from “Review” loops back across the main route. The process is familiar, but the drawing leaves several questions unanswered.
| Design problem | Specific revision | What becomes clearer |
|---|---|---|
| Box labeled “Draft” | Write “Submit draft for review” | The action that starts the process |
| “Review” has two unlabeled arrows | Use “Draft approved?” with Yes and No branch labels | Which condition selects each route |
| Return line crosses the publication path | Place “Revise draft” below the main route and connect it back to review | Where rejected work goes |
| “Done” could mean approved or published | Use “Approved draft ready for publication” as this diagram’s end | The scope boundary |
| Different colors have no explanation | Use a neutral style; add color only for a named purpose | Meaning does not depend on guessing a color code |
The revised route is: submit draft → review → “Draft approved?” If Yes, the approved draft is ready for publication. If No, revise the draft and return it to review. Publication itself is outside this example’s boundary; add it only if the chart’s purpose requires that stage.
A useful review question is “Can you trace the No path without touching the Yes path?” If the answer is no, move the revision step rather than adding another bend to an already tangled connector. If the diagram still needs a verbal explanation for every arrow, improve the labels before adding icons.
Choose a style that supports the reading task
Keep similar shapes at similar sizes when their labels allow it. Use enough contrast between text and its background, and avoid placing a long paragraph inside a decision diamond. Where more explanation is necessary, give the step a short label and place the detail beside the chart.
Use color sparingly and accompany it with text. A red shape might mean an error to one reader and a priority to another. A label such as “Needs revision” explains the state even when the chart is printed without color.
Apply the design in Mockitt
Build the agreed route in Mockitt, then refine its arrangement. Start with the process and decision shapes; decorative elements can wait until the sequence is understandable.
The Mockitt flowchart guide shows adding shapes, connecting them, and entering text. Use those operations to recreate the content-approval example and compare the straight main route with the separate revision loop.
Let us have a look at the steps for creating a simple flowchart online with Mockitt:
1. Place “Submit draft,” “Review draft,” and “Draft approved?” in a consistent reading direction.
2. Add the approval outcome on the main route and “Revise draft” beside or below it.
3. Connect the actions and label the Yes and No paths. Leave room for the return route before adjusting spacing.
4. Review the diagram at its intended reading size, then share it with someone who performs the process. Ask them to trace both an approved draft and a rejected draft.
When the process changes, update the affected action and trace every route that depends on it. Keep the editable chart as the working record, and use exported images only as copies for presentations or documents.