A pricing page helps a visitor decide whether an offer fits their task, budget and expected usage. Use Mockitt’s online prototype editor to review plan cards, billing choices and the route into checkout. The goal is a well-informed choice, not simply keeping someone on the page for longer.
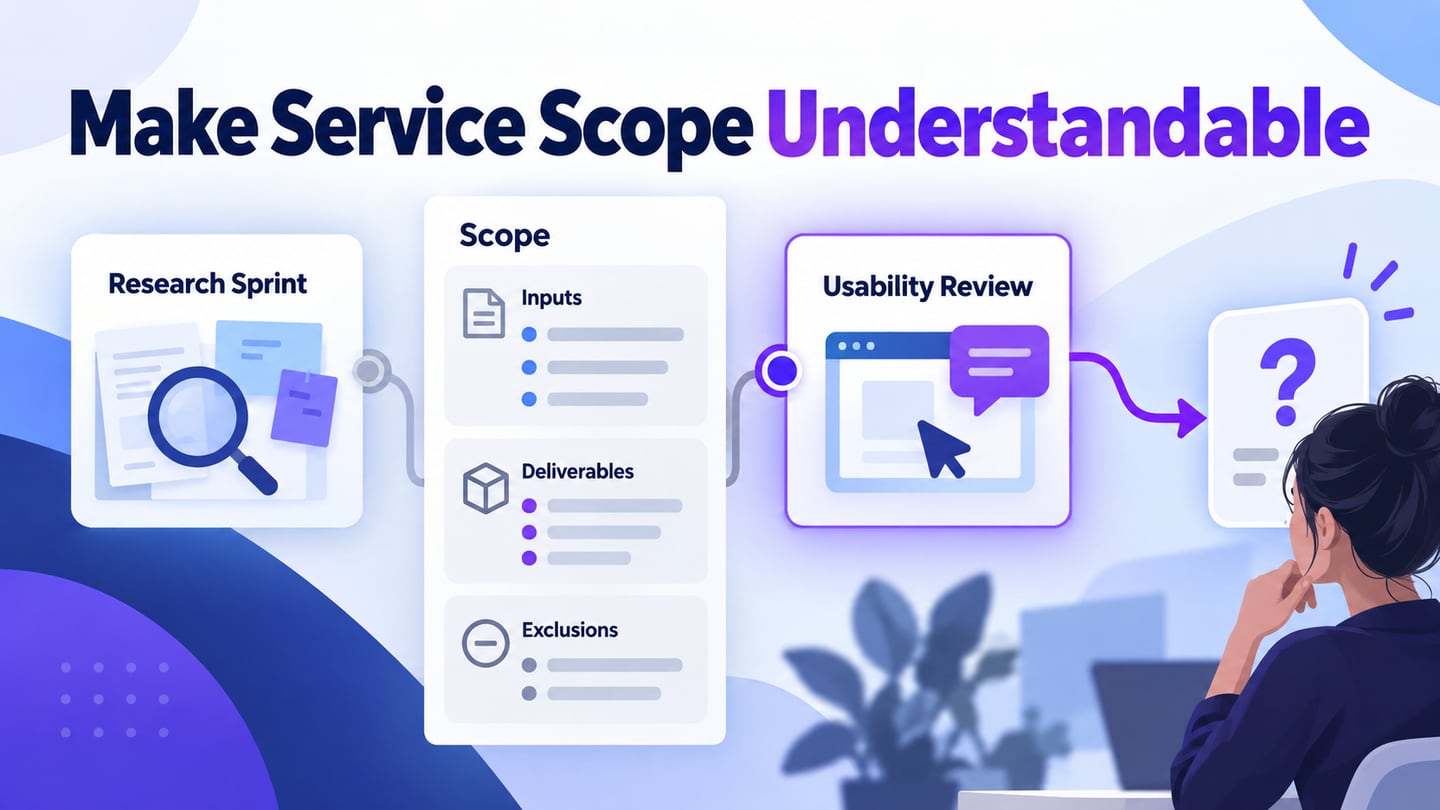
State what is being priced, the currency, the billing period and the important limits. A low headline number is misleading if readers cannot tell whether it is per person, per month, billed annually or conditional on a minimum purchase.
Use these pricing references as layout examples. They are not applications that build pricing pages, and their historical screenshots do not establish current prices, trials or payment terms.
Design a pricing page prototype online
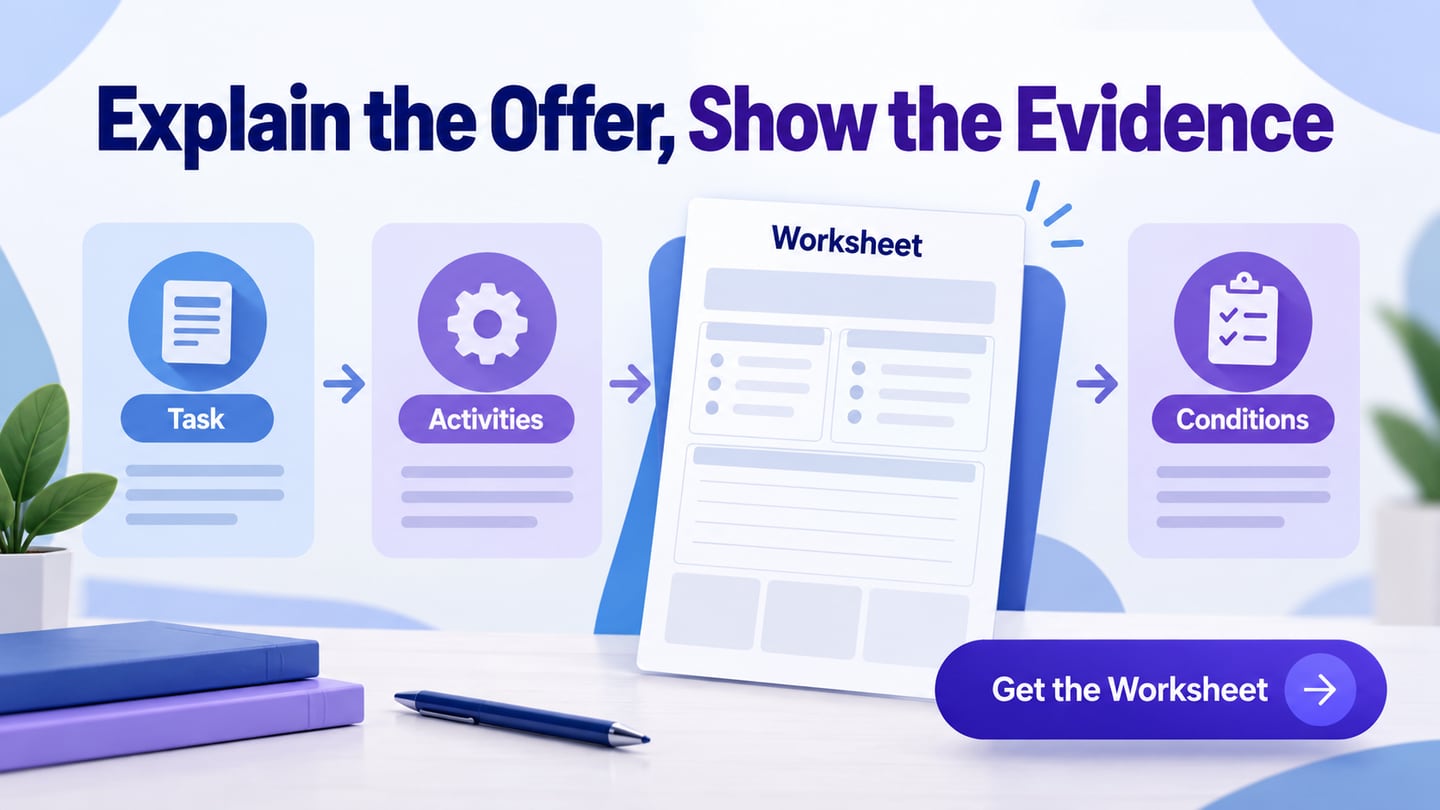
Start with a plan inventory approved by the people responsible for the offer. Record the intended audience, included capabilities, meaningful limits, billing basis and the next action for each plan.
Arrange the plan cards using consistent labels and units. Highlight a plan only for a defensible reason, such as its fit for a stated audience; do not automatically label the most expensive option “Best.”
Add a detailed comparison only for differences a visitor needs to evaluate. Avoid filling the table with rows that repeat the same check mark across every plan while hiding the few important limitations.
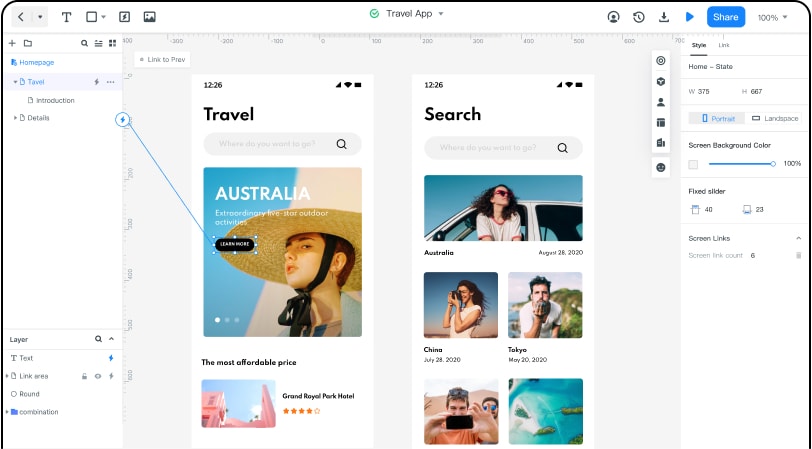
Use realistic descriptions and long plan names in the prototype. Check that the card can grow when text wraps, and keep enough space between the explanation, billing controls and the main action.
Create a mobile view that preserves comparison meaning. Stacking cards is one option, but the reader still needs to know which plan each feature belongs to. Do not shrink an entire desktop table until its labels become unreadable.
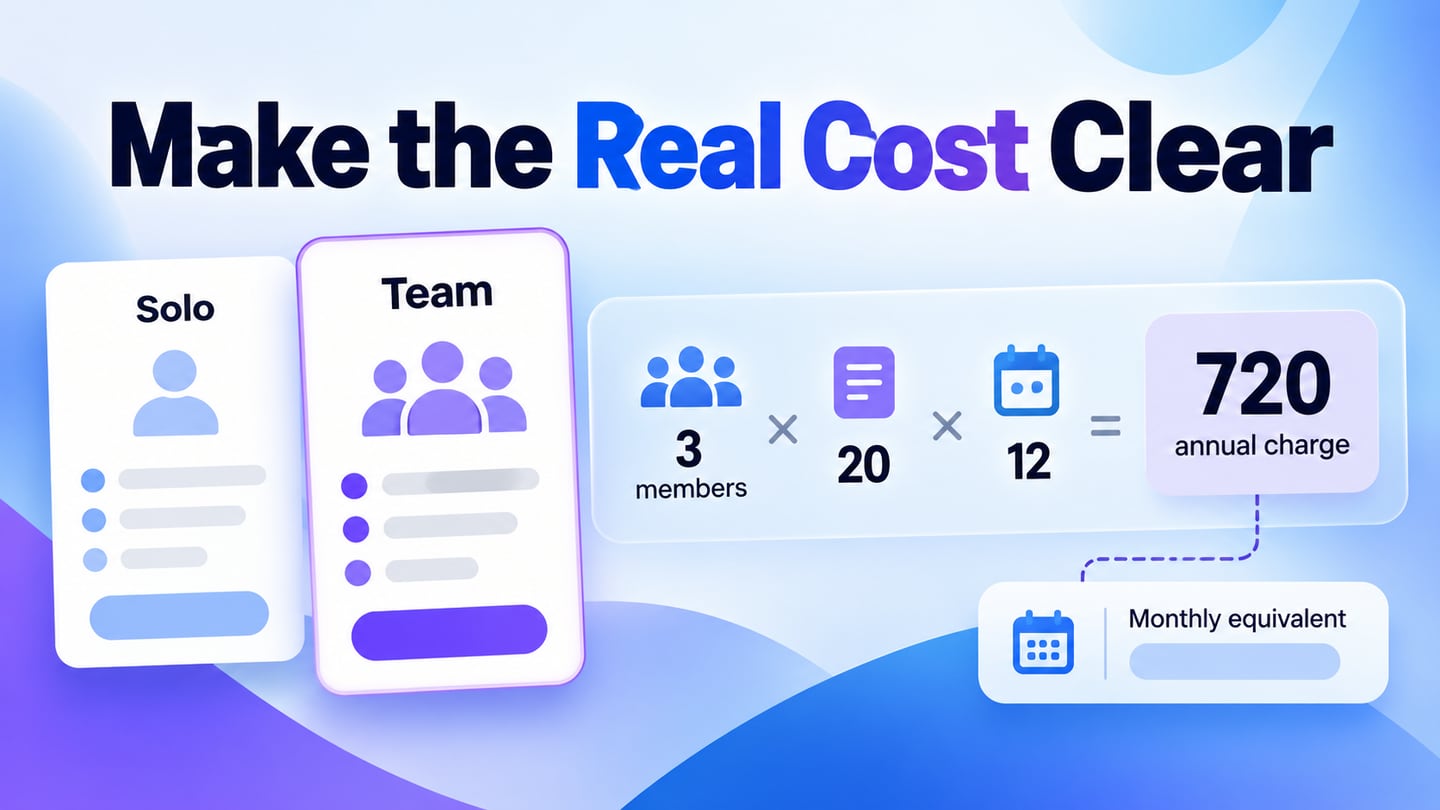
For an illustrative team workspace, compare Solo at $12 per month with Team at $20 per member per month. If the Team example is billed annually, show the annual amount for the selected member count as well. For three members, the example annual charge is $720; this is fictional pricing used to test clarity, not a Mockitt offer.
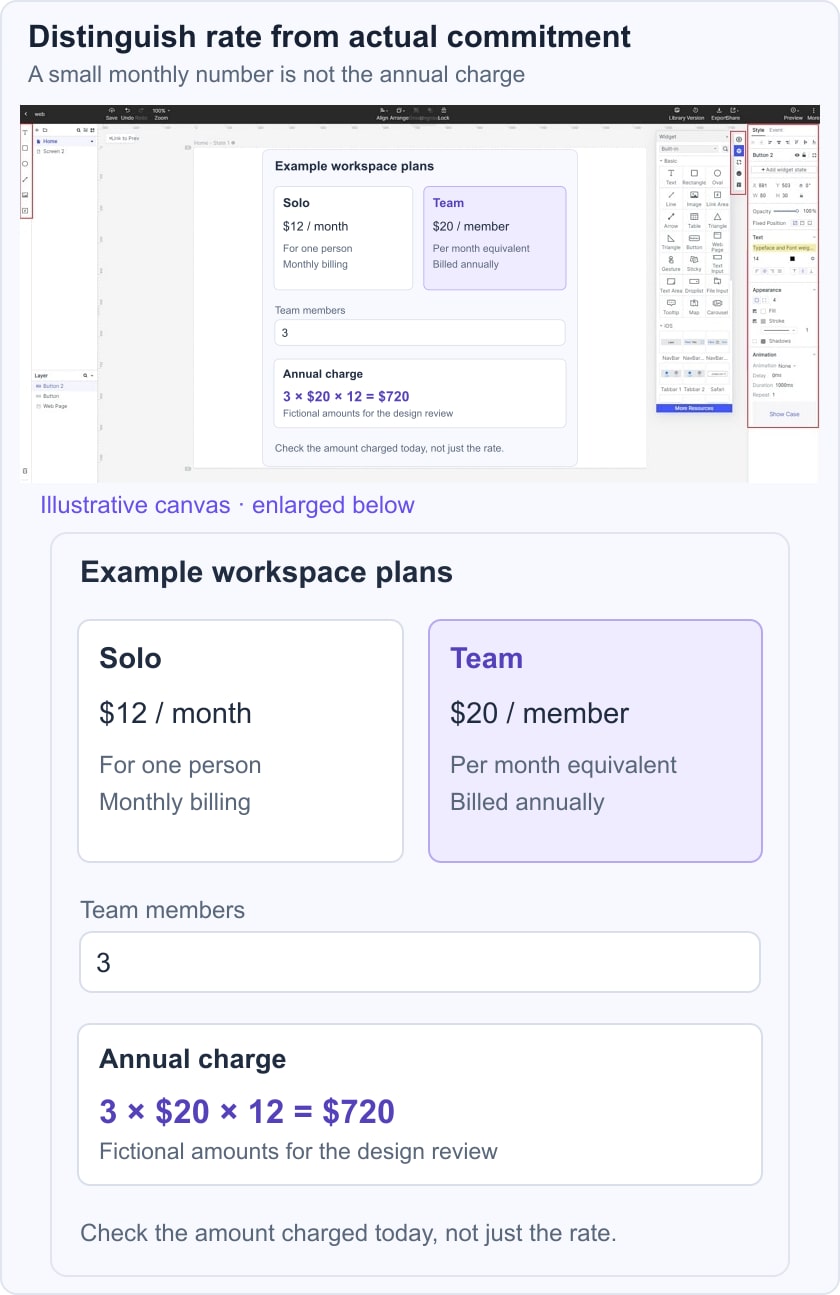
Ask a reviewer to choose for a three-person project and explain what will be charged today. Then change the billing period and member count. The amount, unit and explanation should update together. If the reader reports only the smaller monthly equivalent, the page has not made the actual commitment clear enough.
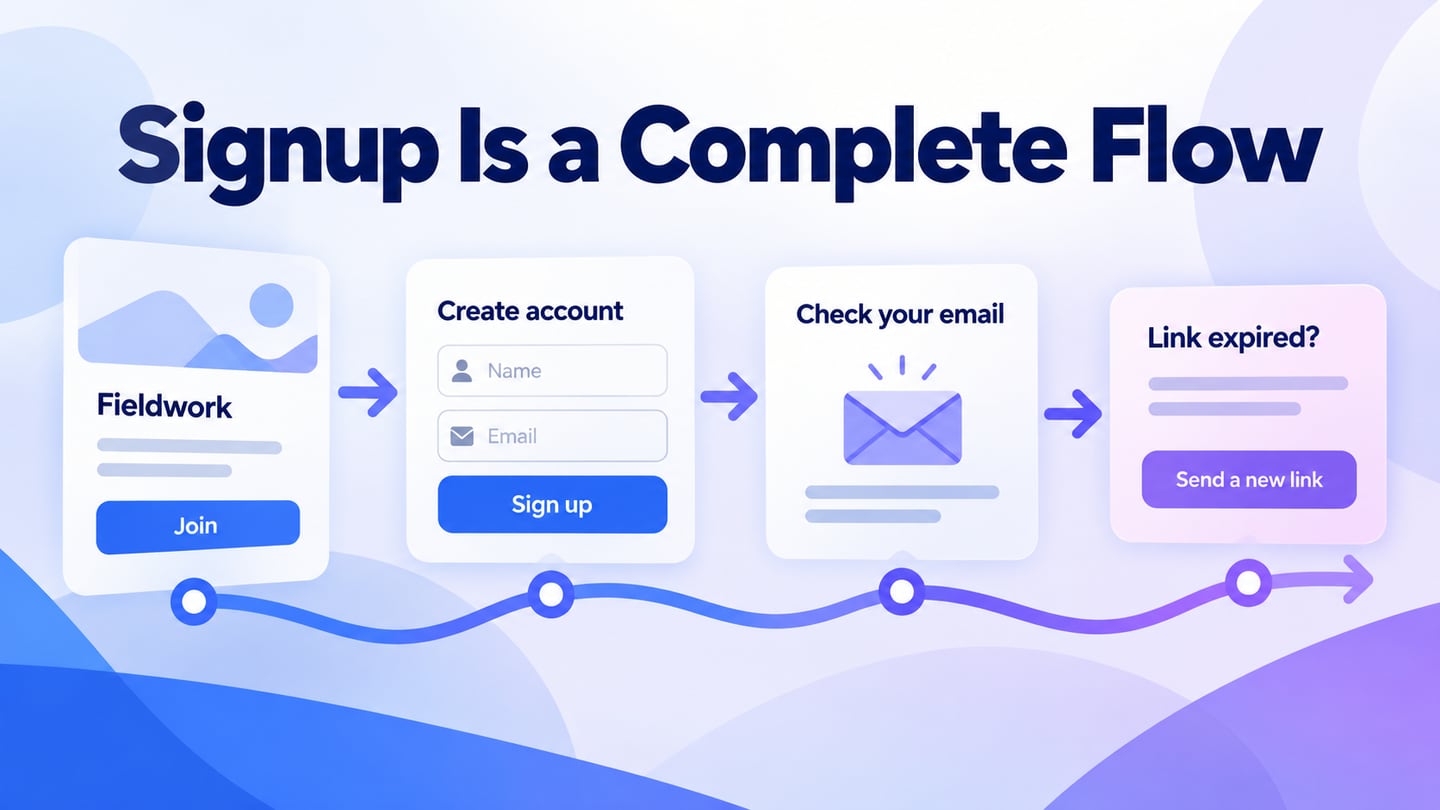
Connect the selected plan to the payment flow and verify that the same plan, quantity and amount appear there. Share the prototype with billing, support and development before the visual design is finalized.
Seven historical pricing references and what they teach
Use the visible structures below as prompts for your own review. Current commercial terms must be checked on the relevant official site before making a purchase; the archived figures are not maintained offers.
#1: Box
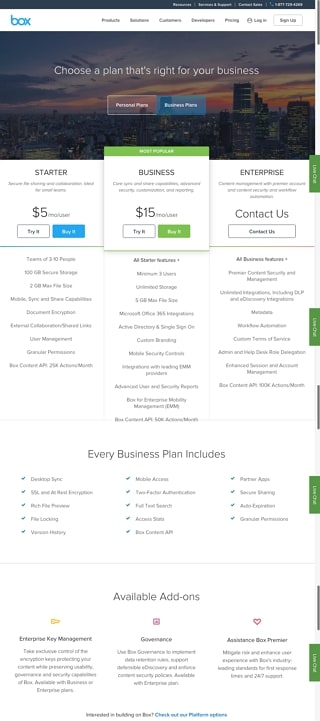
The Box capture uses plan columns with audience labels, prices and included capabilities. The useful lesson is comparability: readers can scan the same type of information across options.
Keep units and limits consistent. If one plan is priced differently or requires a sales conversation, explain that difference rather than forcing a false side-by-side equivalence.
A highlighted plan can draw attention, but its recommendation needs a clear audience or use case. The image does not show support for every currency or language.
#2: Zendesk
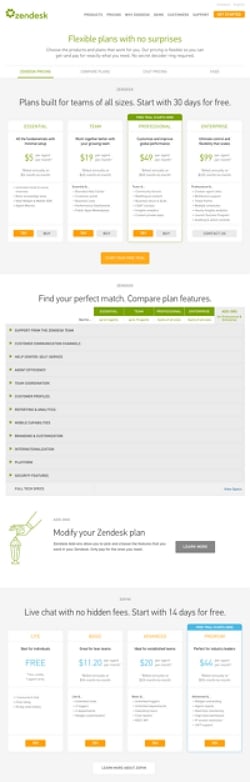
The Zendesk capture combines a compact plan summary with a longer comparison. This is useful when different readers need different levels of detail: a first decision and then a closer feature check.
Make the comparison usable at narrow widths and with assistive technology. The W3C table guidance explains the importance of associating data with meaningful headers. A visual grid alone does not provide that relationship.
Do not infer that a pricing page automatically changes prices during market events. The layout should communicate the actual maintained offer and any conditions that affect it.
#3: Wistia
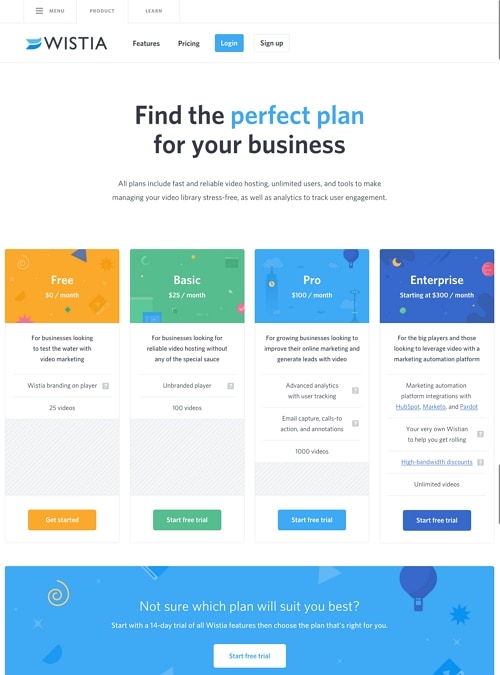
The Wistia capture separates plans with clear headings and brief audience descriptions. This lets a visitor begin with fit rather than comparing an undifferentiated list of features.
Use a short description to explain who the plan serves, then show the relevant limits. Color can distinguish cards, but the labels and content must carry the same meaning without color.
The image does not establish personalized price negotiation or visitor profiling. Do not promise that leaving a page will produce a different price unless that behavior is part of a verified offer.
#4: Casper
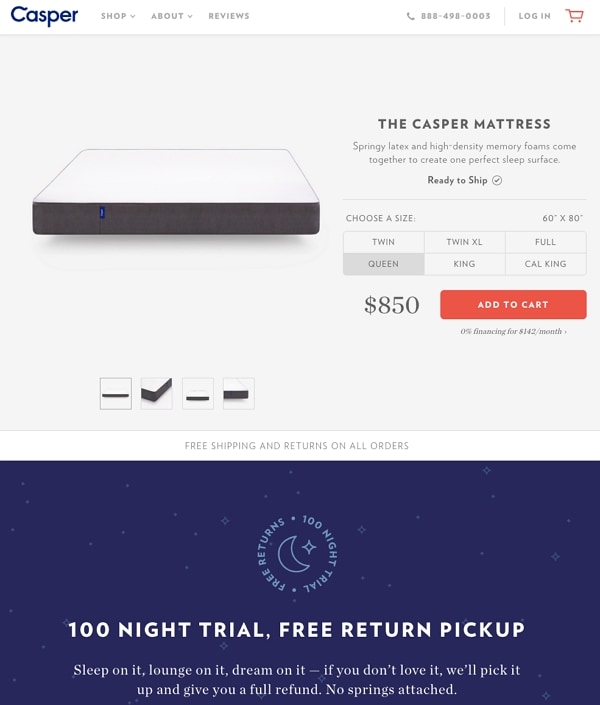
The Casper capture is a product-detail page with a size choice and price, not a subscription-pricing tool. It is useful as a contrast: a physical product variant may change the amount without changing a recurring plan.
Make the selected variant clear and show how changing it affects the price. Carry the choice into the cart instead of asking the customer to repeat it.
A product page may need dimensions, availability and delivery information that would not belong in a software feature matrix. Choose the pattern for the actual purchase decision.
#5: Ticketleap
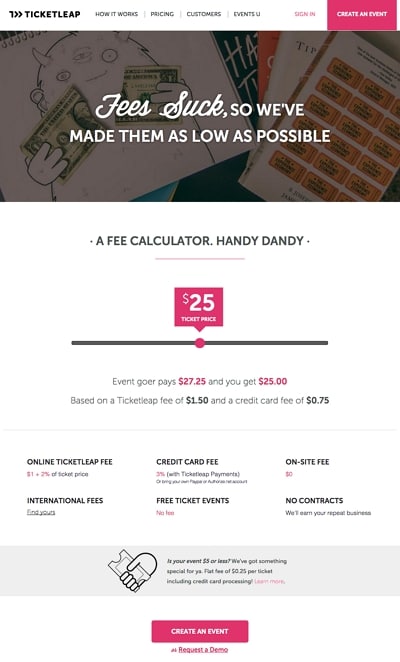
The Ticketleap capture shows a fee calculator and an explanation of charges. This can make a variable cost understandable when the input and output are clearly labeled.
State who pays each fee and which assumptions the calculation uses. Test zero, unusually large and invalid input values. A calculator should not silently hide an additional charge below the initial viewport.
The old screenshot’s amounts are historical. It does not establish current fees or prove that prices are negotiated with individual visitors.
#6: Slack
The Slack image is a homepage with trial and sales actions, not a complete pricing comparison. Its useful lesson is distinguishing a self-service next step from a conversation with sales.
Do not infer supported payment methods, plan terms or a pricing model from a homepage. On your own pricing page, make the destination of each action explicit and preserve the selected plan context.
#7: Bombbomb
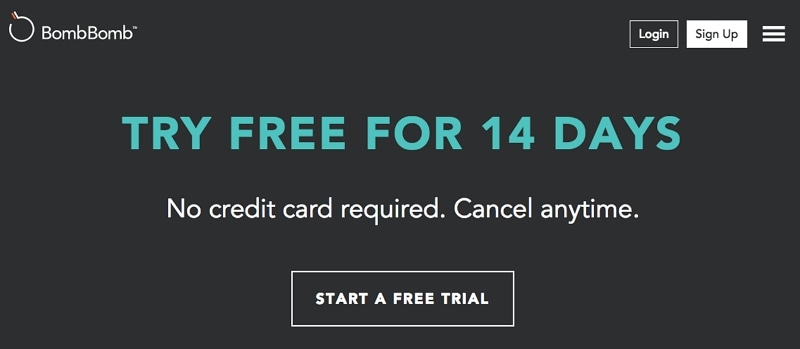
The BombBomb capture is a historical trial message. A trial action needs clear duration, access limits and the conditions that apply when the trial ends.
Keep any cancellation explanation and billing requirement near the relevant action. Do not copy the archived 14-day offer into current advice or assume that a trial and a permanently free plan are the same.
The strongest pricing layout makes differences and commitments understandable. Check actual terms, preserve comparison meaning and verify that the next page agrees with the selected offer.
Before release, test long text, mobile card stacking, keyboard use, billing toggles and the final total. Put policy-sensitive questions in a maintained FAQ section and make unusual requirements easy to discuss through a contact route.