A web dashboard turns data into information for a decision. Before choosing charts or arranging cards in a UI design workspace, identify who uses the dashboard, which question they need to answer, and what action follows. A chart that looks polished but hides scope, units, or missing data can make that decision harder.
Organize navigation and filters around the user’s tasks. Interviews, contextual inquiry, or card sorting can help test labels and groupings. Do not assume that a designer’s internal categories match the language used by the people reviewing the data.
How to design a web dashboard and prototypes with Mockitt
Mockitt can be used to arrange and connect web dashboard screens for review. A prototype lets the team inspect the information hierarchy and drilldown flow before implementing live data and permissions.
For example, design a dashboard for an order-operations reviewer. Show the selected date range, orders awaiting dispatch, and a table that opens an individual order. Keep that date range visible in the detail context. Represent unavailable data separately from a true zero, and explain what the reviewer should do when a delayed order needs attention.
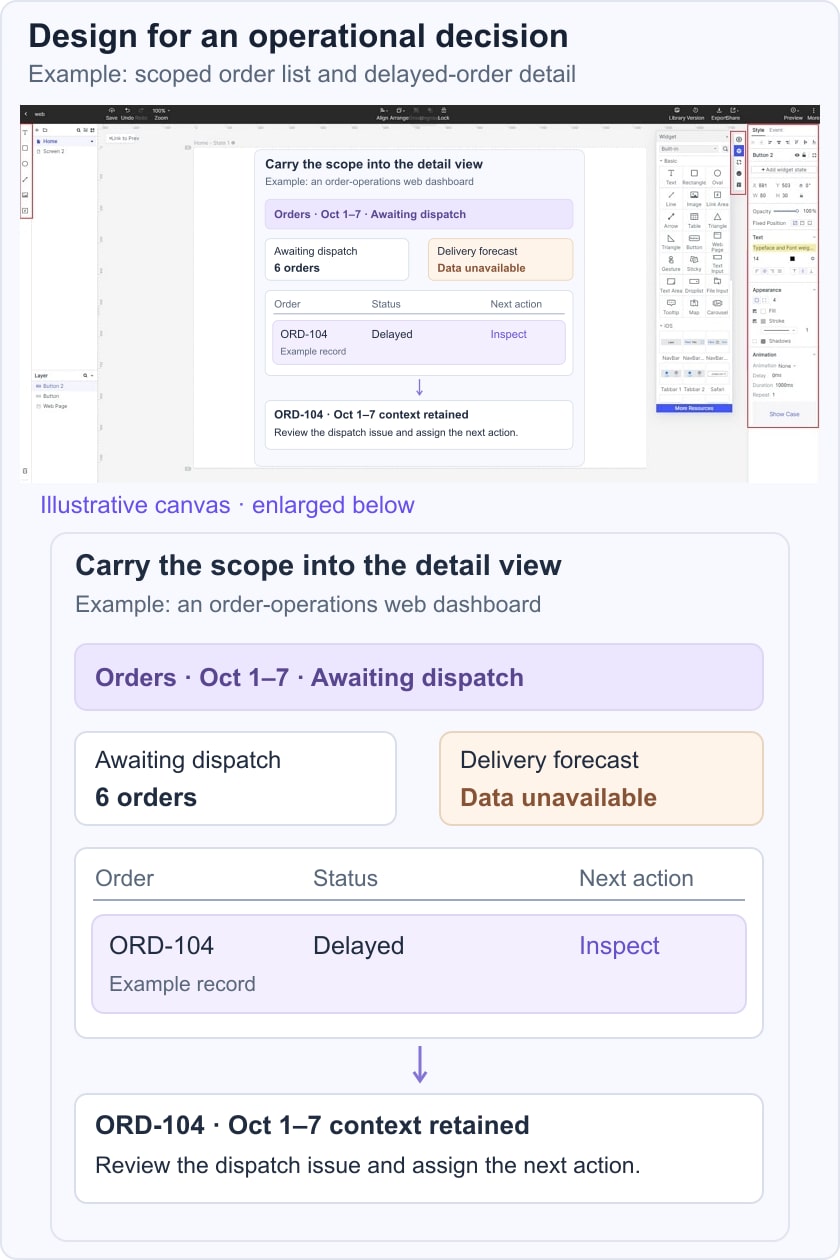
Use a realistic content sample and the states that matter to the review. The original editor image illustrates an earlier general screen-building workflow; it does not show a live data connection or a finished dashboard.
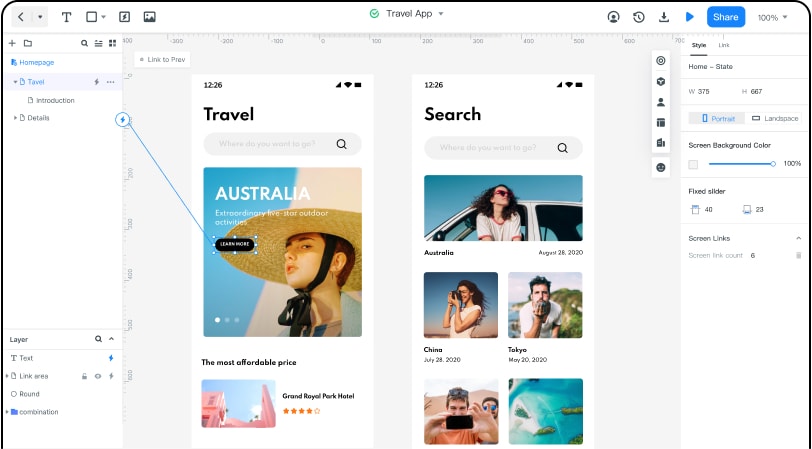
Begin by opening the current workspace and creating a web-sized prototype.
1. Select the appropriate project space and check who needs access to the review.
2. Start with a blank canvas or a suitable available template. Remove sample metrics that do not answer the chosen question.
3. Create an overview and the detail screens needed for the task. Name them by their purpose.
4. Add summary values, a table or chart, and the relevant controls. Label the scope, units, and status of the example data.
5. Set a clear hierarchy and enough spacing for scanning. Keep related values and their labels together.
6. Connect filters, selected rows, and return actions where they are part of the review task.
7. Add empty, unavailable, or error states that could change the interpretation. Do not use a blank card to represent every case.
8. Preview the flow. Ask the reviewer to find a delayed order, inspect it, and return without losing context.
5 essential factors that a good dashboard web design should have
1. Use Dynamic Content
Show changes that matter to the user’s decision, together with a clear time scope or freshness indicator where appropriate. Static reference information can still be useful; not every dashboard element needs to update continuously.
2. Avoid Excess Padding
Use space to group related information while keeping frequently used controls accessible. Excessive gaps can make comparison difficult, but removing all padding creates a dense and hard-to-scan interface.
Keep search, sort, and filter controls near the data they affect. Review the actual content density instead of assuming that fitting everything above the fold is always best.
3. Design for the Relevant User Roles
Understand what each role is responsible for and which decisions it needs to make.
An operations reviewer may need exceptions and order detail, while a manager needs a different summary. A role-specific prototype explains the intended view; access enforcement must still be implemented and tested in the application.
4. Test Whether Priority Information Is Easy to Find
A brief glance can reveal whether the hierarchy is clear, but a fixed five-second rule is not a universal measure of dashboard quality. Use a realistic question and observe whether the intended user finds and correctly interprets the relevant information.
Distinguish quick monitoring from deeper investigation. The important summary should be easy to scan, with a clear route to the detail needed to explain an exception.
5. Select and Define the Relevant Metrics
Choose metrics from the user’s decision and the business definition. Record the time range, units, calculation, and source needed to interpret each value. Do not add a large collection of KPIs simply because a template has space for them.
For the order-operations example, write a definition beside the design specification: “Awaiting dispatch” counts orders in the selected period that are ready for dispatch but have no recorded dispatch event. Agree with the product and data owners whether cancelled orders, partial shipments, and records with missing status belong in that count. This is an illustrative definition to resolve before implementation, not an assumed rule for every business.
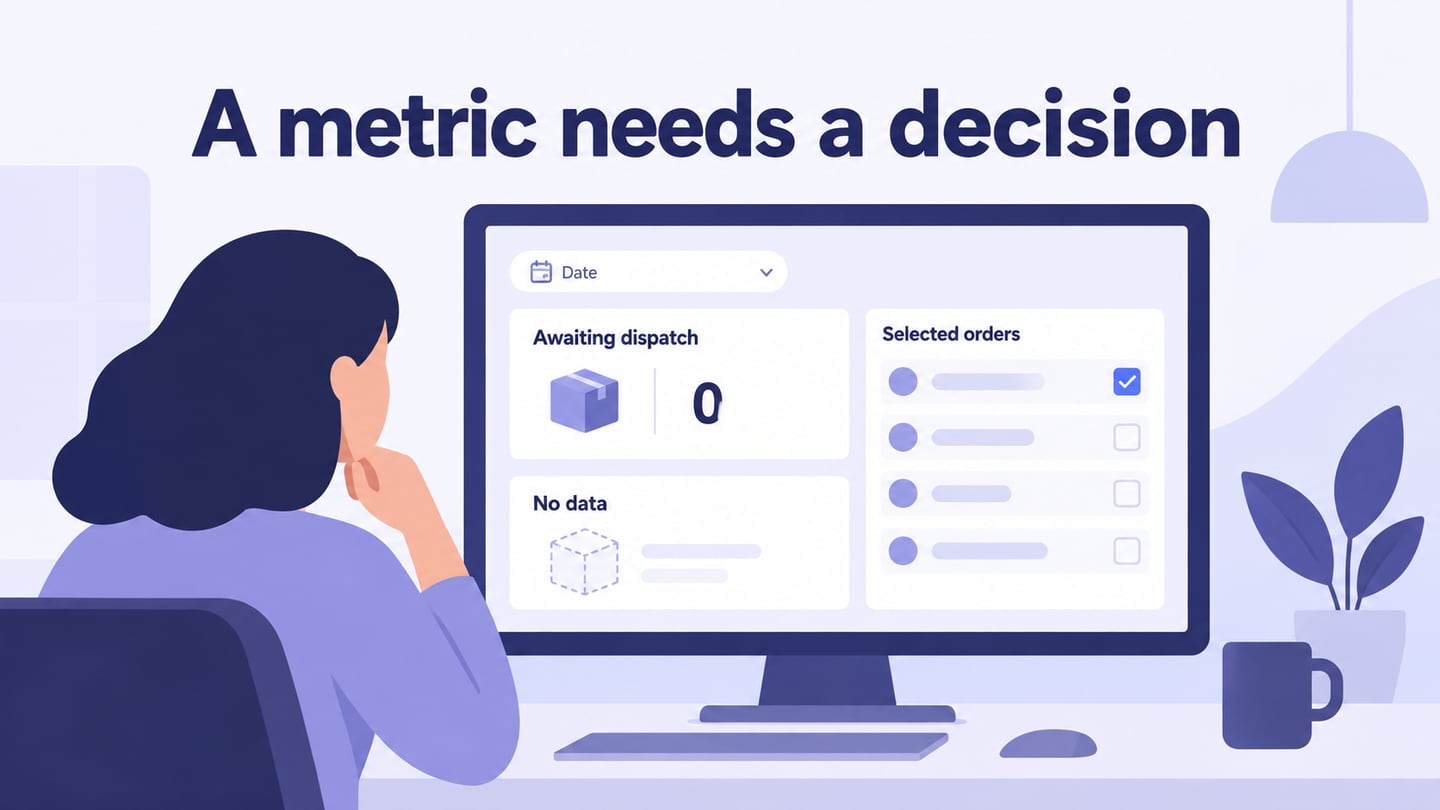
Give each state a distinct meaning. A true zero means the query completed and found no matching orders. “Data unavailable” means the count could not be established; keep the last successful time visible if an older value remains on screen. A filtered empty list should name the active filters and offer a way to change them. Do not replace all three conditions with a dash that leaves the reviewer guessing.
Before delivery, ask a reviewer to locate an overdue order, explain the period being shown, open its details, and return to the same filtered list. Then repeat with unavailable data. The design should preserve context and offer a useful next action; the application team must verify the real query, permissions, and refresh behavior separately.