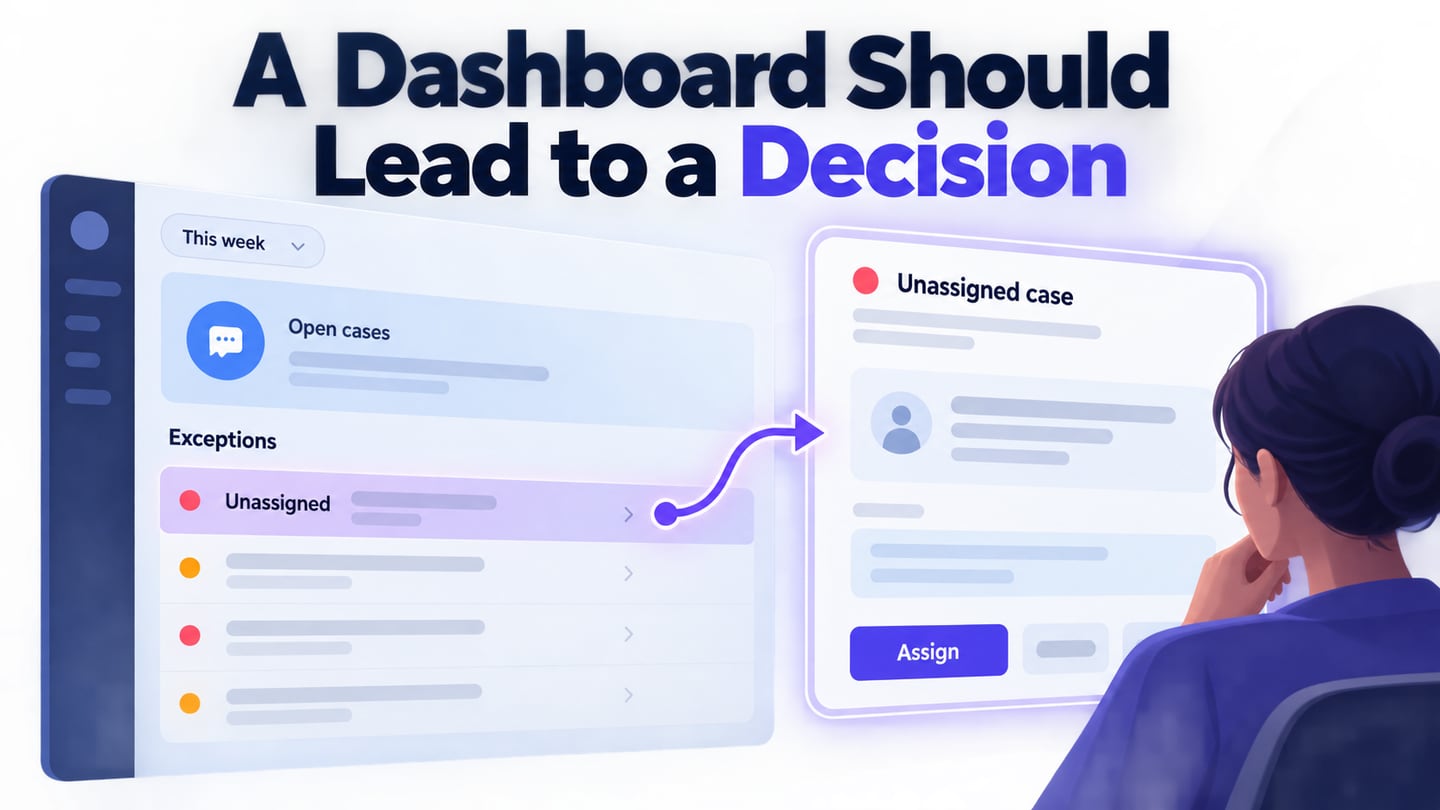
A dashboard is useful when it helps someone decide what to do next. An Ant Design dashboard can combine summary figures, filters and detailed records, but those parts need a shared meaning. Use Mockitt to prototype a dashboard workflow before development so the team can review how a summary leads to a concrete action.
What is Ant Design
Ant Design provides design guidance and a React component library for interface work. Its reusable patterns can help keep a dashboard consistent, but they do not guarantee a particular productivity improvement or define your business metrics.
Start with the audience and decision. A support lead deciding where to intervene needs unresolved work, time-sensitive cases and workload context. An executive summary may need a different level of detail. Trying to serve both with every available chart often makes the dashboard harder to use.
The following design principles remain useful when applied to dashboard content:
1. Proximity
Place related information together. Keep a figure, its unit, reporting period and comparison label in one visual group so a reader does not have to infer what belongs to it.
Vertical spacing
Use a consistent spacing scale to show relationships between labels, values and sections. The earlier examples used 8, 16 and 24 pixels; treat those as design choices to evaluate, not a rule that overrides the needs of every screen.
Horizontal spacing
In order to adapt to screens of different sizes, a grid layout is used to arrange the components in the horizontal direction to ensure the flexibility of the layout.
2. Align
Align related labels and values consistently. Right-align comparable numeric columns when it aids scanning, and show units and precision appropriate to the metric. Percentages, currency and counts should not appear interchangeable.
3. Contrast
Use contrast to emphasize the decision-relevant information, such as cases needing attention. Do not make every figure equally prominent. Status meaning should remain readable without color alone.
4. Repeat
The constant repetition of the same elements in the interface can not only reduce the user's learning cost but also help users identify the relevance of these elements in different interfaces. Repeating elements can be a line, a wireframe, a certain color, design element style, design style, a certain copy format, spatial relationship, etc.
5. Direct interaction
Allow an action close to its context when that is safe and understandable. A filter can update the visible period; an edit that changes a record may require a separate review and confirmation.
- If rows can be reordered, explain what the order means and offer an accessible alternative to dragging.
- If files can be uploaded, show the accepted input and the result or recovery action.
How to make a prototype of an ant design dashboard?
Mockitt can help represent a dashboard’s hierarchy and interactions before it is built. Assemble summary cards, filters and a record list using reusable elements, then create the important states. A visual prototype does not connect the dashboard to live business data by itself.
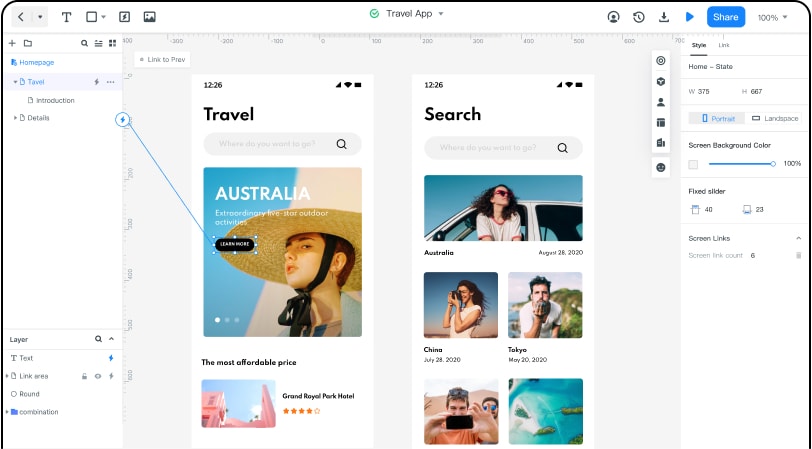
Review the prototype with the people who will make decisions from it. Ask which item needs attention and why. If they must ask what a figure means or which period it covers, improve the labels and grouping before adding more charts.
Prototype capabilities to use
- Convenient user interface;
- Share the Mockitt prototype with appropriate access; it is not an Axure Cloud project.
- Represent interactions for filters, selectors and drill-down actions.
- Detailed customization of elements has been worked out: sizes, background color, font color, rounding of elements, etc.
- Convenient dragging of elements, distances between elements are highlighted;
- Large library of elements;
- Add relevant images or icons where they help explain the interface.
- You can create links between elements.
Rich Resources
Templates and reusable assets can help establish a consistent starting point. Keep the layout only where it supports the dashboard’s purpose; remove decorative charts that do not answer a question.
Choose the smallest set of data needed to review the flow. Label demonstration data as examples, and do not imply that a prototype is displaying live performance results.
Easy to collaborate and share
A shared prototype gives reviewers the same reference for discussing the interface. Comments should identify the decision, metric definition or missing state that needs attention.
Record agreed definitions next to the design: what is counted, which records are excluded, the time zone and the update interval. These details influence the interface as much as colors and spacing.
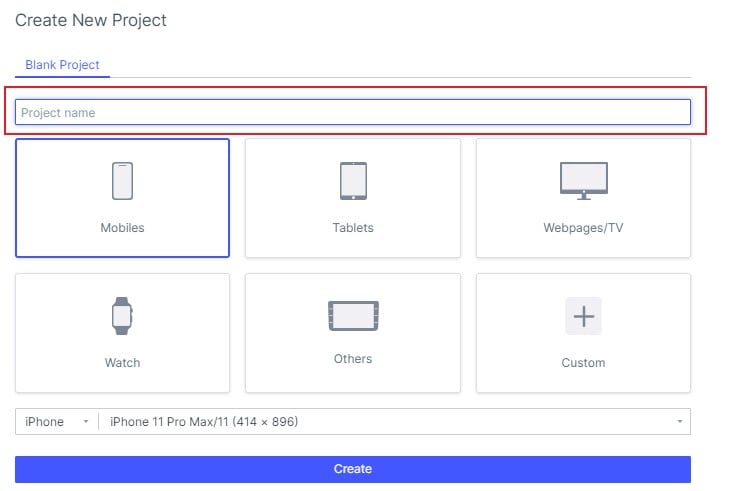
1. Create a support-operations project and define the lead’s main task: find unresolved cases that need intervention. The retained captures show earlier Mockitt interfaces; current controls and available templates may differ.
2. Add a period filter and label every summary figure with that period. A count of unresolved cases at the end of a day is not the same as cases opened during the day.
3. Put an exception list beneath the summary. Include a case identifier, current status, owner and last update so a reviewer can explain why a case deserves attention.
For the example dashboard, the selected period is “This week.” A summary card describes cases awaiting a response, while the list highlights case CS-218 as unassigned. Selecting that row opens its detail view. The prototype’s figures are illustrative; the team must separately agree on how a case enters or leaves the count.
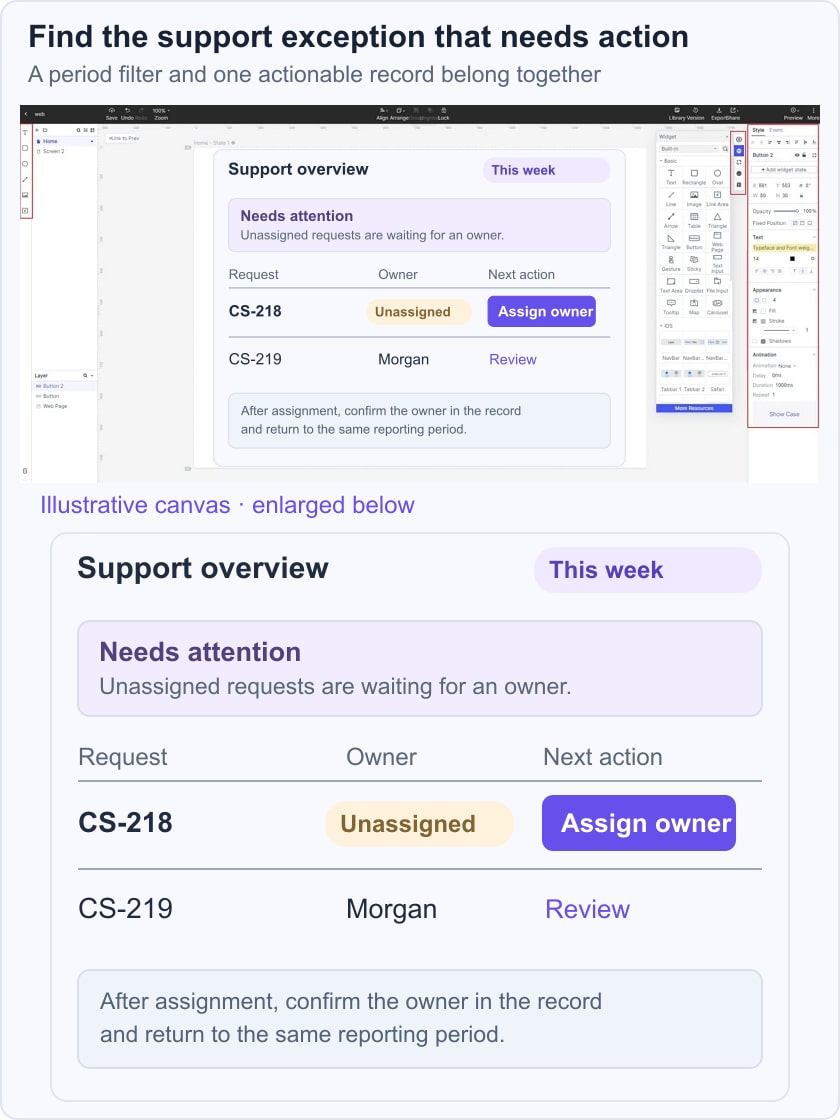
Use the Ant Design table workflow for sorting and selection behavior. If the detail view has related panels, specify the tab interactions separately so the dashboard and record view stay consistent.
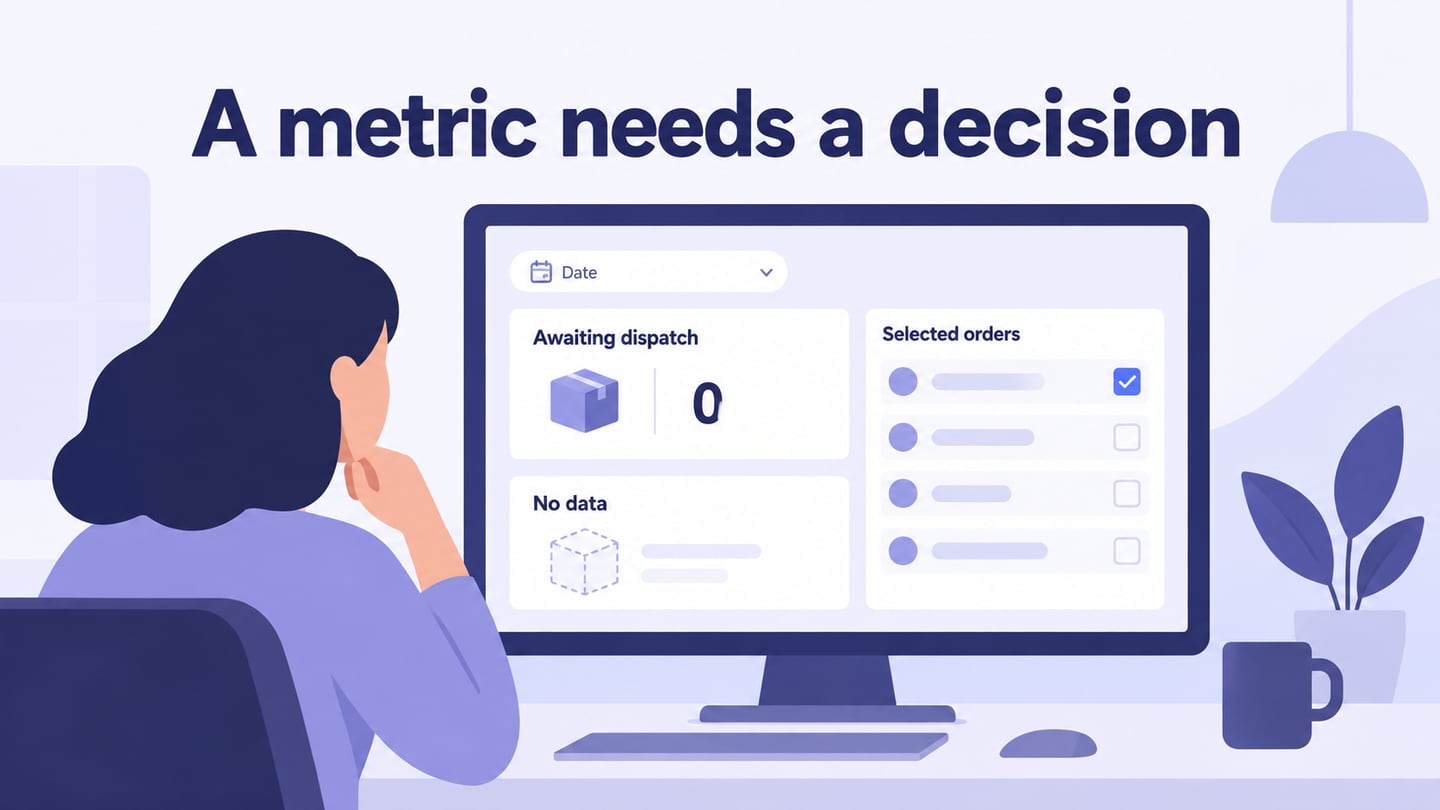
4. Add loading, no-results and stale-data states. Distinguish “no cases match this filter” from “the data could not be retrieved,” and keep the selected period visible in both.
5. Preview the summary-to-detail path with a reviewer. Check that filters apply consistently, units remain visible, and returning to the dashboard preserves the intended context. Hand off the metric definitions and error states alongside the screen designs.
A useful review task is: “Find a case that needs an owner and explain which information led you there.” If the reader follows a large decorative chart instead, the hierarchy is working against the task. Revise the emphasis and repeat the review before connecting the production data source.