
Original illustration
Visual design shapes how information looks and how its parts relate. It appears in education, publishing, branding and digital products, but its purpose is more specific than making something attractive: it can help a person notice the right detail, understand a grouping and identify an action. Visual presentation should support the information rather than compete with it.
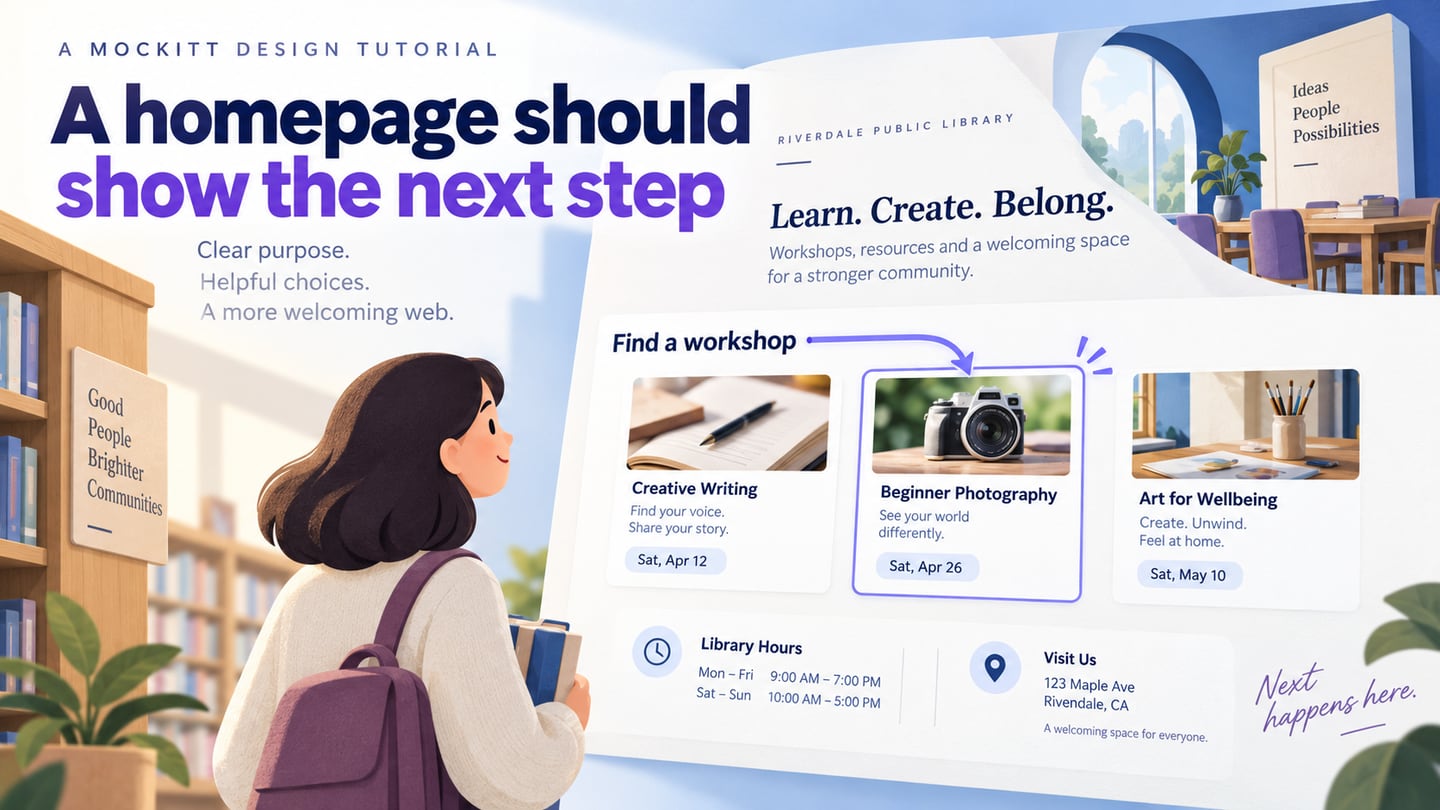
In a digital product, visual design connects appearance with usability. You can explore those decisions in Mockitt’s UI design workspace by arranging the same content in different hierarchies. A convincing composition is a useful starting point; checking whether people understand and use it remains a separate task.
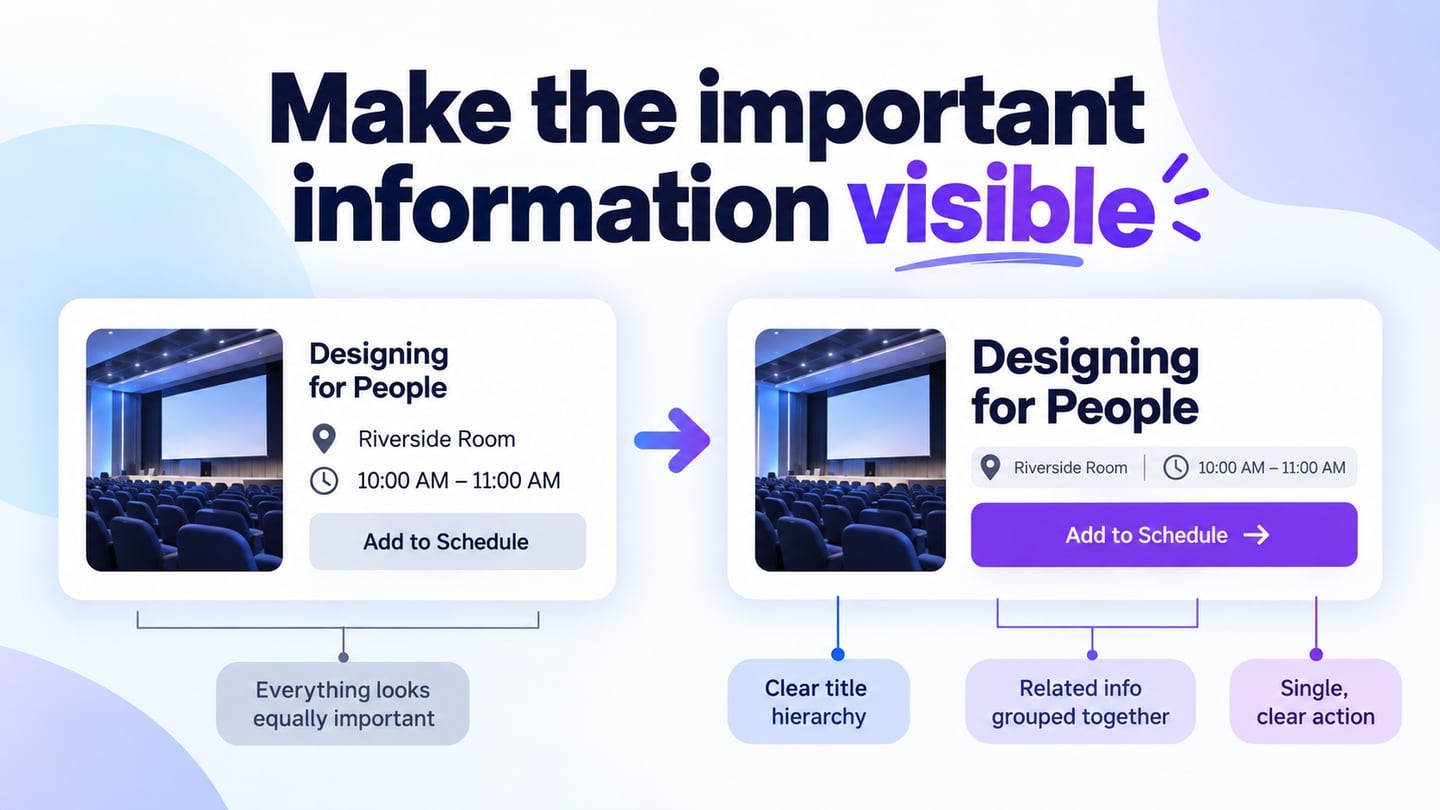
Consider a conference programme. If the session title, room number and action all have identical emphasis, the reader must work out their relationship. A clearer hierarchy can make that relationship easier to inspect. This is a design hypothesis to review with realistic content, not a promise that a color or font will automatically increase trust, sales or loyalty.
What Is Visual Design?
Visual design uses elements such as shape, color, typography, scale and space to communicate. Images, charts, tables and icons are possible tools, not requirements for every screen. Start with the message and task, then choose the form that expresses them. A simple text list may communicate better than an illustration when the reader needs to compare names or find a specific entry.
The original nine areas below provide a practical vocabulary for reviewing a composition. They overlap: changing scale may alter hierarchy, while changing spacing may alter perceived grouping.
- Point, Line and Shape
Points can mark locations or events; lines can connect or divide; shapes can group content or represent controls. Use them deliberately. On a programme card, a subtle divider may separate session details from the action, but unnecessary outlines can make every item appear equally important. Ask what relationship each visible line or boundary communicates.
- Color Palette
A UI color palette should give colors consistent roles, such as surface, text, action and status. Choose colors that suit the context, then test the actual combinations. A pastel palette is not automatically calming or readable, and a bright palette is not inherently suitable for every young audience. Keep meaning available through words, shape or other cues as well as color.
- Typography
Type size, weight, line length and spacing establish hierarchy and reading rhythm. Use typography in UI design to distinguish a session title from supporting information without creating a different treatment for every line. Test long titles, unfamiliar names and increased text size. A distinctive display face may work for a short heading while being unsuitable for dense body text.
- Balance, Rhythm and Contrast
Balance concerns the distribution of visual weight; rhythm comes from repeated patterns and intervals. Contrast helps distinguish elements, but subtle visual contrast and sufficient text contrast are different questions. Check text against its actual background using the W3C contrast guidance. A visually quiet layout must still be readable.
- Scale
Scale communicates relative emphasis. A large heading may establish the topic, but making everything large removes the distinction. Compare the title, metadata and action at the size where the design will be used. The correct hierarchy is determined by the task; there is no rule that every page must simply move from the largest item to the smallest.
- Texture and Pattern
Textures and patterns can add context or character, but they are optional. They need not produce a three-dimensional effect. Keep them away from areas where they interfere with text, controls or meaningful diagrams. Check whether a pattern becomes distracting when repeated across a long list or compressed into a small thumbnail.
- Form and Frame
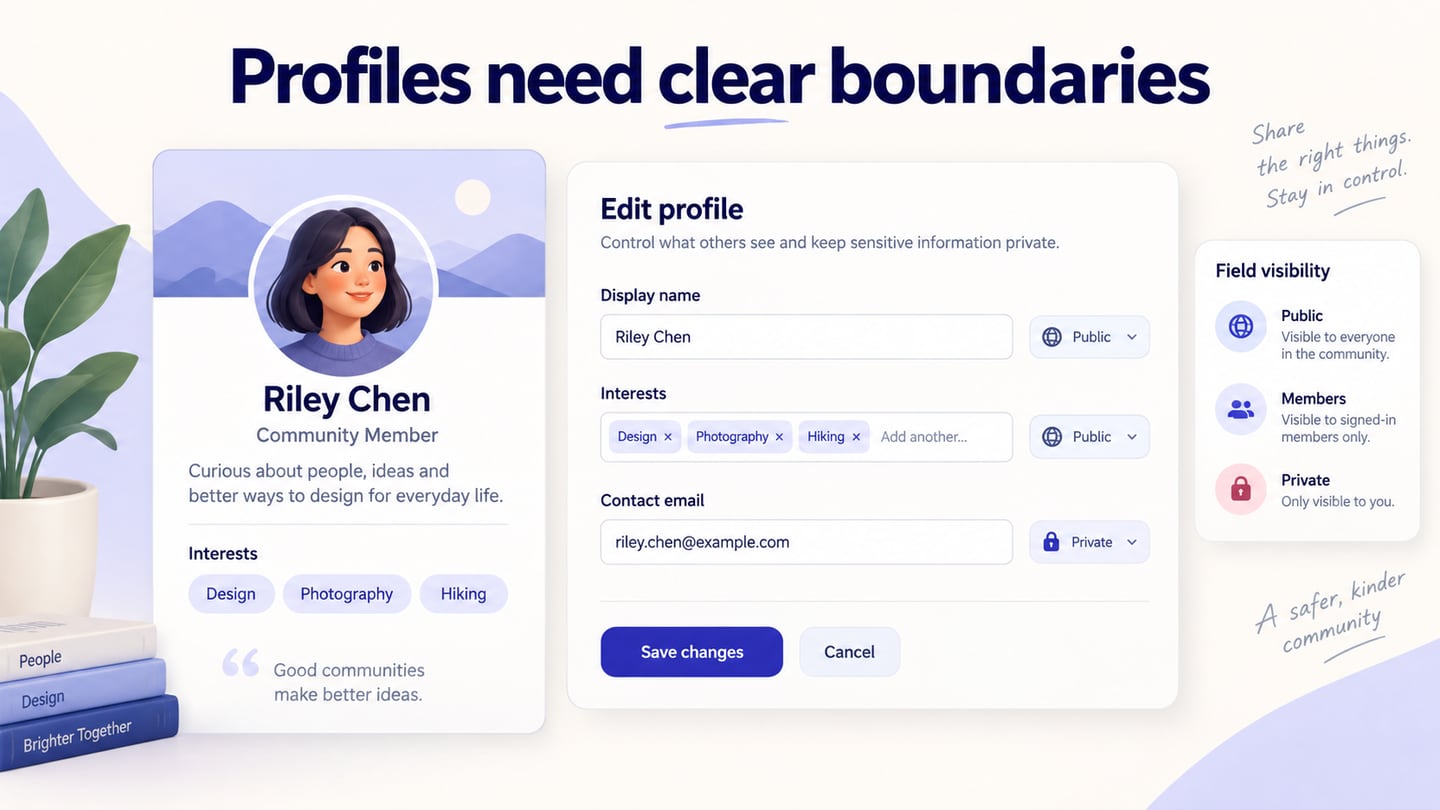
A frame can clarify which information belongs together. On a card, its background and spacing may be enough; a heavy border is not always necessary. Avoid putting several unrelated actions inside one container merely to make the layout tidy. The visible grouping should match the information’s relationship and the reading order.
- Visual Concept
A visual concept gives the composition a coherent direction. Describe it in terms of the communication task: for example, a programme that helps a visitor choose the next session. That direction provides a reason for decisions about hierarchy and imagery. “Make it modern” is too vague to explain why one detail deserves emphasis.
- Unity and Gestalt
Unity comes from consistent relationships across a composition. Gestalt principles describe ways people perceive organization, including proximity, similarity and continuity. Nearby items often appear related; similarly styled items may seem to have the same role. Use these effects carefully, then check whether the resulting groups match the intended meaning. Consistency does not mean making every component identical.
Everyday Examples of Visual Design
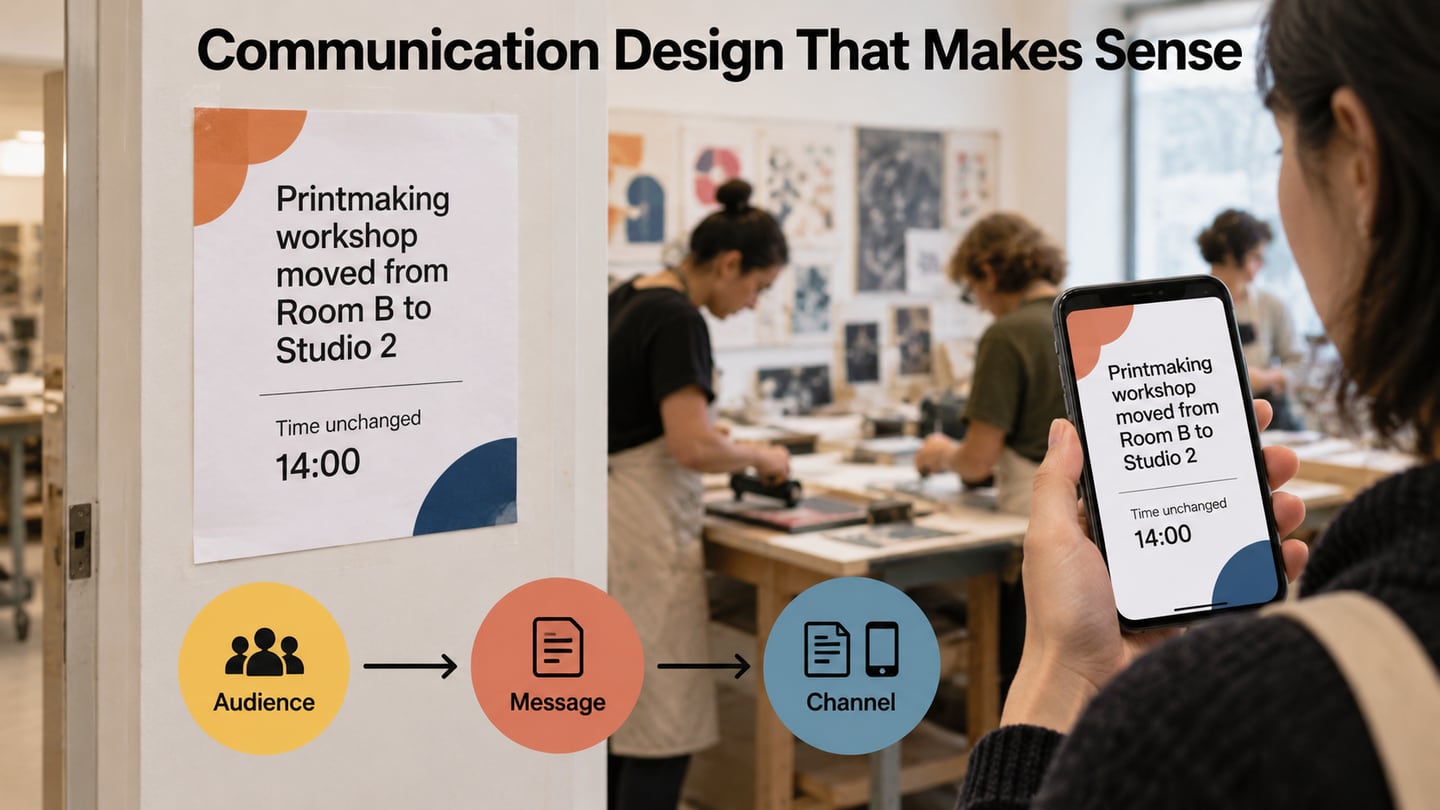
Visual design operates in physical and digital contexts. Newspapers use headings, columns and images to organize stories. Signs use size and contrast to distinguish destinations. Websites use corresponding techniques to establish hierarchy and make actions recognizable. The medium changes, but the need to communicate relationships remains.
A newspaper does not need an image for every story to be readable. Its typography and spacing already do visual work. Similarly, classroom materials may benefit from diagrams when they explain a relationship, while an unnecessary picture can distract from the question. Choose the visual form according to what the reader needs to understand.
Information sites such as Wikipedia combine headings, paragraphs, tables and relevant images. A table helps compare attributes; a diagram can show a process; a caption explains what an image demonstrates. These are useful examples of matching presentation to information rather than treating all media as interchangeable decoration.
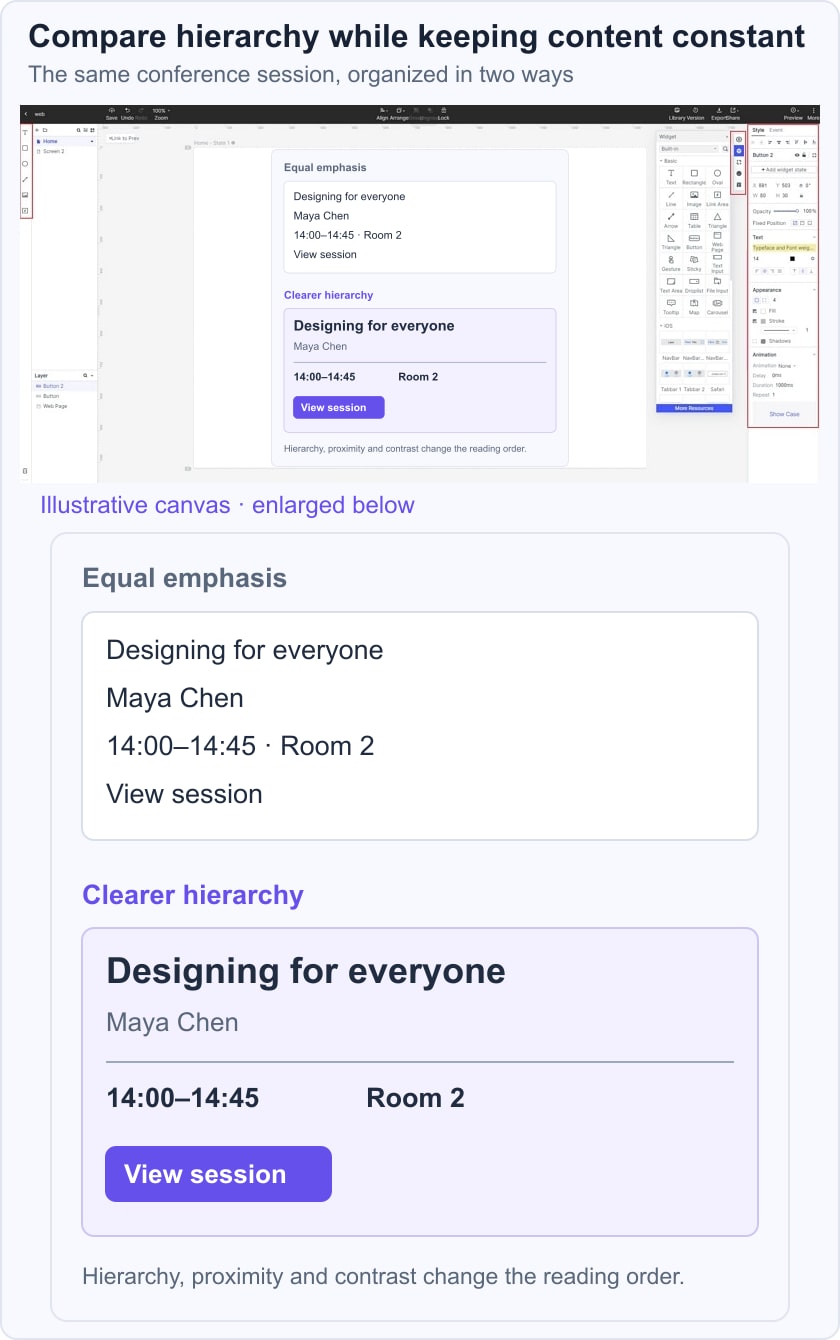
Postcards, brochures, banners and social posts also use hierarchy to communicate a message within limited space. A useful exercise is to hold the wording constant while changing emphasis, then ask a reader what they noticed and what they would do next.
For a conference programme, take the session Designing for everyone, speaker Maya Chen, time 14:00–14:45 and Room 2. Give the title the strongest emphasis, group time and room as practical details, and keep View session distinct as the action. Compare it with an equal-weight version containing exactly the same information. Ask someone to identify the session, its location and the next action without explaining the layout first.
Common Uses of Visual Design
Visual design contributes to many forms of communication. Its usefulness depends on the fit between the audience, message and context, not simply on producing an eye-catching result. A packaging label, a reading app and a game may use the same elements for very different purposes.
Common applications include:
- Logos and identity systems that make a brand recognizable across contexts.
- Books, newspapers, magazines and comics that organize reading and support their narrative.
- Advertising in print, outdoor media and digital channels that communicates a specific offer or message.
- Website and application interfaces that show information, controls and state.
- Packaging that presents identity, contents and practical instructions.
- Games that distinguish characters, environments, actions and feedback.

How Visual Design Relates to UX
Visual design is one part of user experience. It cannot repair a missing function, an inaccessible interaction or misleading content on its own. The following relationships provide more useful review questions than assuming that an attractive screen is automatically easy to use:
- Usability: can a person distinguish an action from a label, find a relevant detail and recognize the current state?
- Comprehension: do the composition and reading order explain which elements belong together?
- Emotional tone: does the visual treatment suit the task without assuming that all readers react the same way?
- Identity: are the visual choices consistent enough to feel coherent while allowing important exceptions to stand out?
- Trust and experience: does the presentation accurately represent the information and available actions? Validate the full journey rather than attributing loyalty to appearance alone.
Conclusion
Visual design works best when its choices have a clear purpose. Retain the information a person needs, establish a readable hierarchy and use consistent cues to communicate relationships. The conference-card exercise makes those decisions visible because the underlying content stays the same.
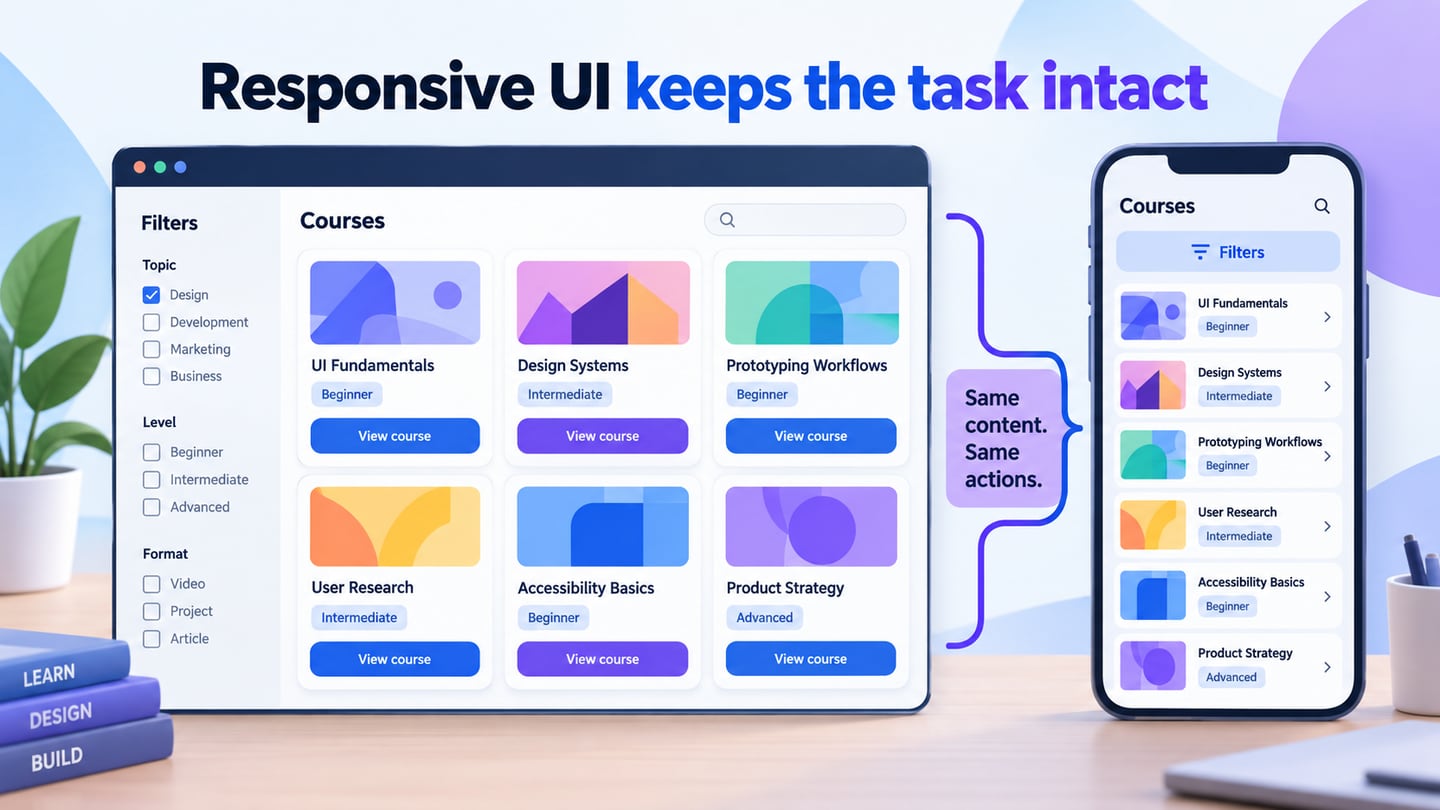
Review the design with realistic text and an understandable button hierarchy, then check it at narrow widths and with larger text. A composition that remains clear under those conditions is a stronger starting point for implementation and user testing than one judged only at a polished presentation size.