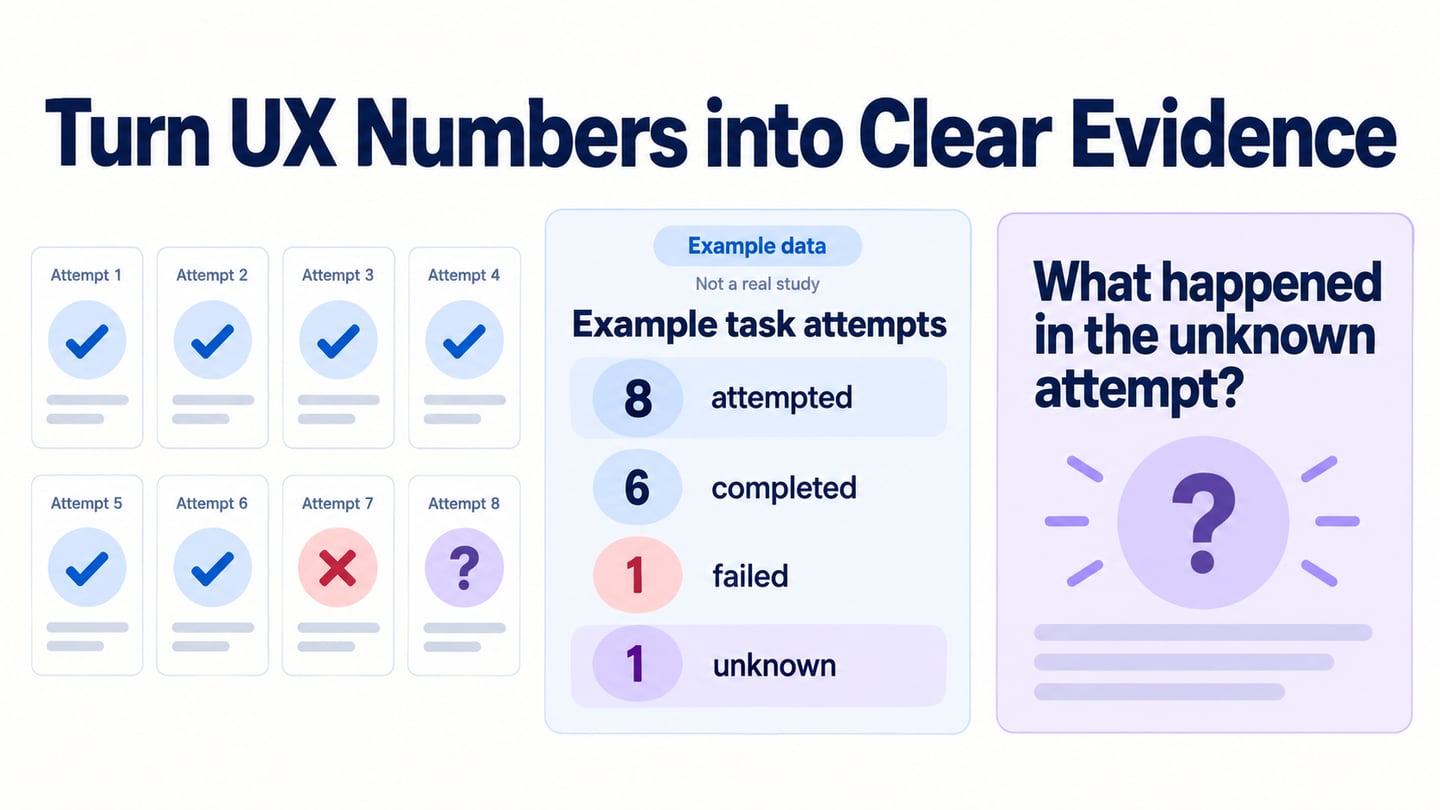
Quantitative analysis examines numerical measurements and counts to answer a defined question. In UX research, that might mean how often people finish a task, how long a successful attempt takes, or how responses differ between groups. The numbers need a clear definition, a known source, and an appropriate denominator. They can describe patterns and support decisions, but they do not remove bias or explain every reason behind behavior.
Quantitative Analysis Definition
Quantitative analysis is the systematic examination of numeric data, using summaries, comparisons, or statistical models suited to the question. Revenue, task duration, error counts, and survey ratings are examples. A number is not automatically a reliable measurement: “completed” must mean the same thing for each record, and a rating scale must be interpreted according to what it asks.
Start with descriptive analysis: counts, proportions, distributions, and measures such as a median. More complex methods depend on the study design and assumptions. Regression, data mining, and linear programming are not the only three ways to analyze data, nor are they interchangeable. NN/g’s quantitative research overview describes methods used to measure aspects of user experience.
Regression estimates relationships between variables; a fitted relationship does not by itself establish causation. Linear programming is an optimization method for objectives and constraints that can be expressed in linear form. Data mining covers a broader family of approaches for finding patterns in data, not simply a combination of regression and linear programming. For a small task study, a transparent table may answer the question better than an elaborate model.
Qualitative analysis examines meaning in material such as interview accounts and observation notes. Quantitative and qualitative work can support each other. A task-completion count indicates a pattern; an observation may help explain a failure. Categories can also be counted, but coding a statement as a number does not make the interpretation objective or the distance between categories meaningful.

Examples of Quantitative Analysis
These simple examples illustrate numeric quantities. Each requires a unit, a population or object, and a clear collection context:
- A container holds one gallon of milk: a volume, with the measurement system specified.
- A person’s measured height is five feet: a continuous measurement reported at a chosen precision.
- In an illustrative survey, 18 of 20 respondents choose an option: a proportion with its denominator shown.
- A school has 500 enrolled students on a stated date: a count for a defined population.
- A vehicle has four passenger seats: a capacity, not evidence that four passengers traveled.
- An inbox received 100 messages during one day: a count that needs rules for spam and duplicates.
- The English alphabet has 26 letters: a count of the stated set.
The distinction matters in product research. A click count is not a count of unique people, a session is not necessarily a completed task, and a time value without a start and end event is difficult to interpret.
The following examples cover ways to collect, organize, or sample data. They are inputs to analysis rather than four equivalent analysis techniques.
 Illustrative photograph; the number on the tablet is not a finding from this guide.
1. Closed-ended questionnaires
Closed-ended questions offer predefined responses such as yes/no, a choice, or a rating scale. Count responses against the number of eligible respondents, and distinguish skipped questions from a negative answer. Keep categories clear and include an appropriate “not applicable” option when needed. A convenience sample of volunteers should not be described as representative merely because its answers are numeric.
2. Machine data analytics
Software logs can record events such as opening a page, submitting a form, or receiving an error. Before analysis, check that events fire when intended, identify repeated events, and separate test traffic where appropriate. Define whether a metric uses users, sessions, or attempts. A change in instrumentation can look like a change in behavior even when the experience has not changed.
3. Structured data
Structured data follows a defined schema, such as rows for participants and columns for task status or duration. It can include numbers, dates, categories, and text; it is not necessarily quantitative. Use consistent units and allowed values. Keep a codebook so another analyst can tell whether “0” means failure, no response, or a genuine zero measurement.
4. Random sampling
In simple random sampling, each eligible member of the population has an equal chance of selection under the sampling procedure. Other probability-sampling designs work differently. Recruiting whoever answers an open invitation is not simple random sampling. Describe how people were selected and who may be missing before generalizing from the sample.
Quantitative Analysis Process
Validation, editing, and coding are important preparation steps. A complete analysis also defines the question, chooses measures, summarizes or models the data, and reports uncertainty. Preserve the raw data and make preparation decisions reproducible.
1. Data Validation
Validation checks whether the data matches the intended collection procedure. Review these four areas:
- Integrity: Look for duplicate, fabricated, test, or otherwise invalid records using documented criteria.
- Screening: Confirm that participants or events meet the eligibility rules for this analysis.
- Procedure: Check whether everyone received the intended task and whether instrumentation changed during collection.
- Completeness: Identify missing fields and interrupted sessions without assuming that all omissions mean the same thing.
Choose validation checks based on the risks in your study. For example, reconcile participant counts with session records and inspect unusual durations against notes. There is no universal rule that contacting a fixed fraction of respondents validates an entire dataset. Log exclusions and their reasons, including how many records remain for each measure.

2. Data Editing
Data editing resolves identifiable errors while preserving an audit trail. Correct a unit only when the source establishes the intended value. Do not change an inconvenient result to match an expectation. A blank duration after a failed task may be structurally different from a missing duration caused by a recording problem.
Missing-data handling depends on why the value is missing and on the analysis. The following approaches require care; they are not interchangeable fixes:
- Complete-case analysis: Excluding rows with missing values can reduce the sample and bias the result. Report the exclusions and consider whether missingness relates to the outcome.
- Imputation: Replacing missing values with a mean, median, or mode can distort variability and relationships. Do not use it as a default convenience step; choose and justify an appropriate method for the study.
- Last observation carried forward: This refers to carrying a person’s earlier measurement forward in longitudinal data, not copying the value from an unrelated row above. It relies on assumptions and can bias results.
- Follow-up: Where appropriate and permitted, clarify an incomplete response with the participant. Do not invent an answer when clarification is unavailable.
3. Data Coding
Coding gives categories consistent labels. For example, use complete, failed, and unknown for task status, with a separate field for the reason. If you code categories numerically, keep the definitions in the codebook. Age bands such as 18–24, 25–34, and 35–44 must not overlap, and their codes are labels rather than meaningful numeric distances.
Worked example: a return-label task
Suppose eight participants try to find a return label in a prototype. Six complete the task, one fails, and one session has no usable outcome record. Report those counts first. Among the seven attempts with known outcomes, completion is 6/7, or about 85.7%; do not quietly label the unknown attempt a success or a failure. State that one of the eight attempted sessions has an unknown outcome.
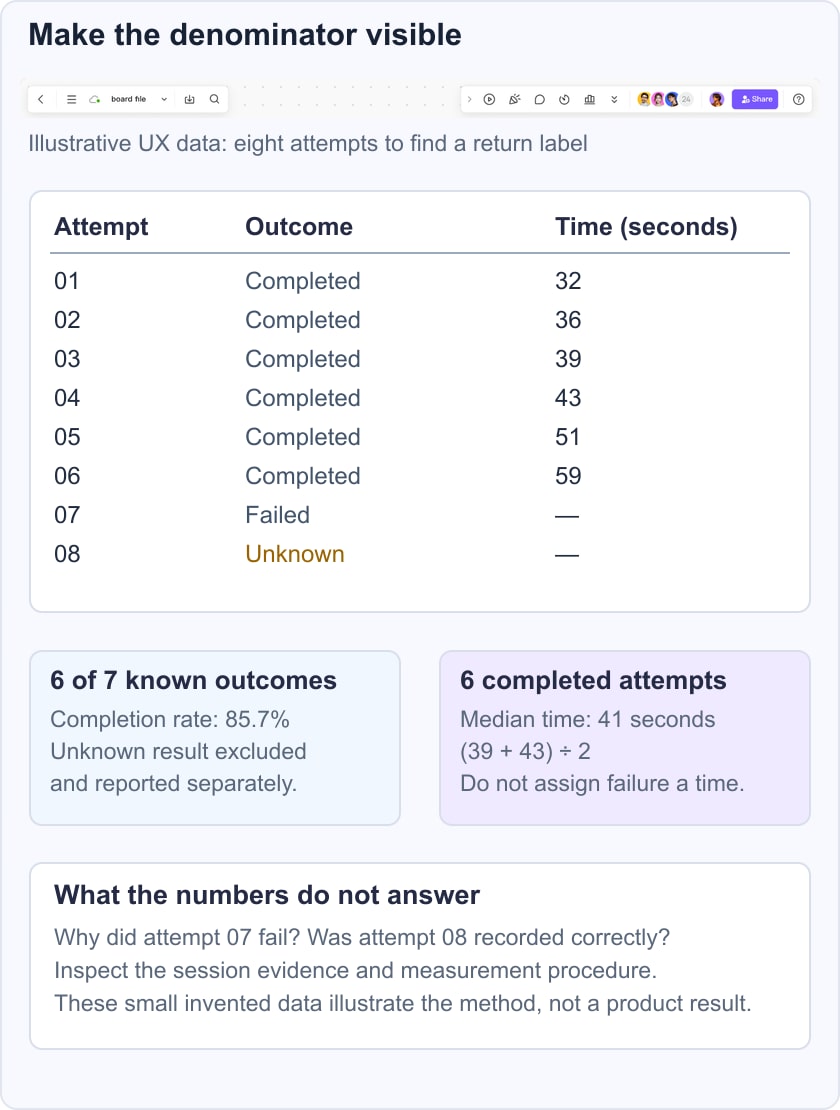
If the six successful durations are 32, 36, 39, 43, 51, and 59 seconds, the median successful-task time is 41 seconds, the midpoint of 39 and 43. Label it as a measure of successful attempts only. It does not summarize the failed or unknown session. These are illustrative numbers, not Mockitt research results, and a sample this small does not support a precise population estimate.
Next, inspect where the failed attempt stopped and whether the unknown record reflects a prototype or recording problem. A useful decision might be to revise the return-label label and run another focused round. You cannot claim that the revision caused an improvement unless the evaluation design supports that conclusion.
Use Mockitt to prepare the design being evaluated
Mockitt can help you build the interactive prototype used in a task study. Keep the tested screens, copy, and interactions consistent for participants in the same round. Record observations and measurements in an appropriate research log or analysis tool; creating a prototype does not automatically produce a valid quantitative study.
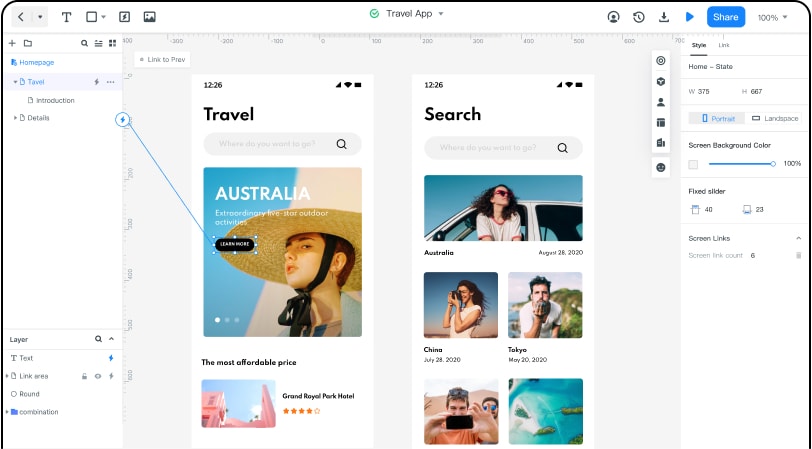
Features of Mockitt
1. Prototyping
Represent the task’s start, success, and relevant failure states. Preview the interactions so that a broken prototype link is not confused with a participant’s difficulty.
2. Collaboration
Share the intended prototype version with reviewers and keep feedback tied to the task. Record any change made between research rounds.
3. Libraries
Use reusable components to keep controls and status messages consistent. Variation should reflect the question being studied, not accidental differences between screens.
Report what the numbers can support
A useful quantitative report states the question, collection method, population, sample, metric definitions, exclusions, results, and limitations. Pair counts with denominators and show distributions where an average would hide important variation. Connect the findings with observed task behavior before deciding what to change. The aim is a defensible decision, not an impressive-looking percentage.