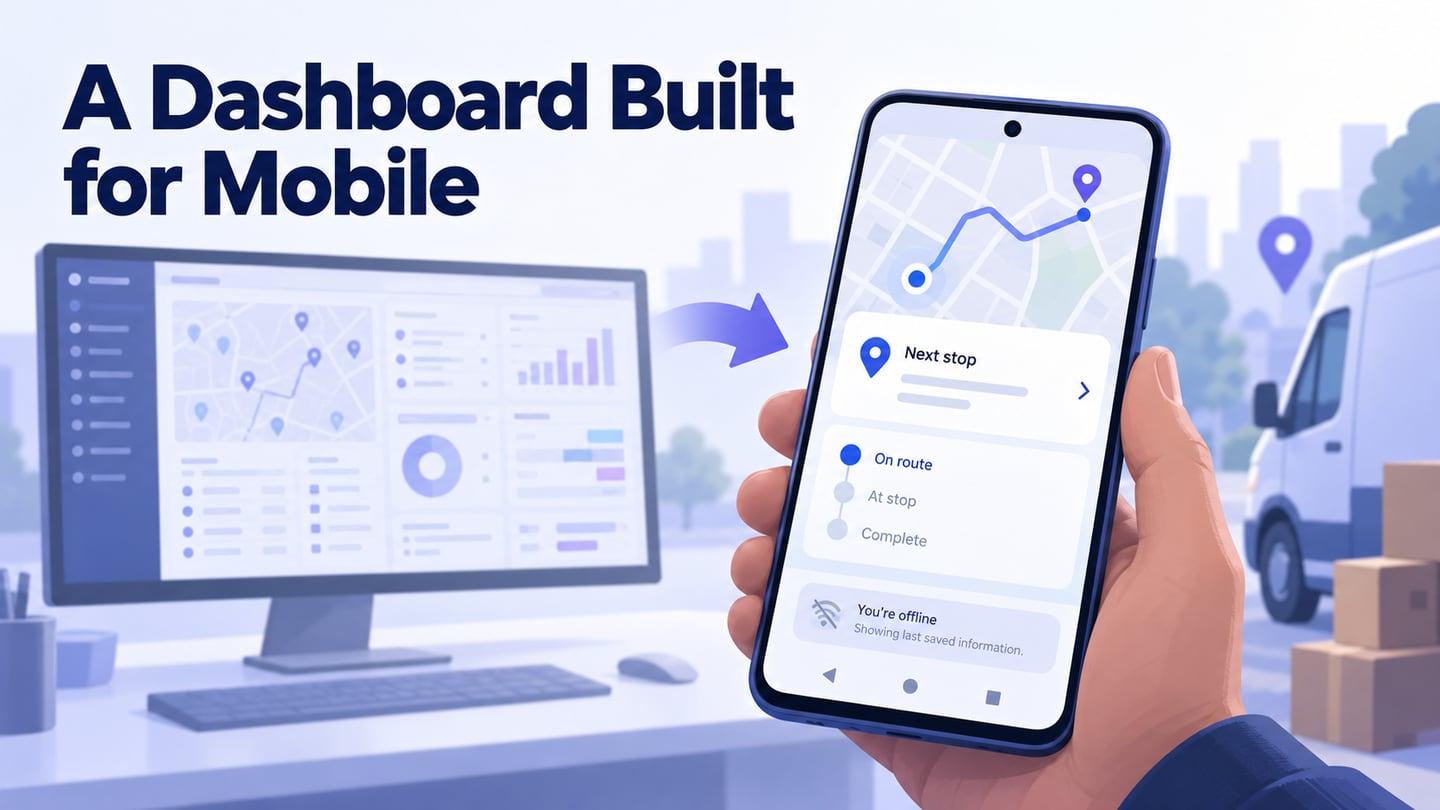
A mobile dashboard should help someone understand the current situation and decide what to do next. More charts and bright colors do not establish that it is useful. Define the decision first, then use a UI design workspace to explore the summary and its details at the size people will actually use.
A dashboard is a summary of relevant status or measures, usually with a route into more detailed information. Not every app home screen or visual feed is a dashboard. The five references below are retained for the patterns they illustrate, followed by a practical workflow for adapting those ideas without copying their appearance.
Five References for Mobile Dashboard Decisions
Use these examples as questions to investigate, not evidence that a particular layout guarantees engagement. Interfaces and features change. Inspect the current product before borrowing a specific interaction, and keep the needs of your own users in view.
- Dropbox — distinguish state from action. A file list provides a useful reference for identifying an item and its availability. Dropbox’s offline-file guidance distinguishes availability from synchronization. In your dashboard, ask whether the person can tell that data is current, pending, or available only from an earlier update; do not replace these meanings with decorative color.
- Airbnb — connect summary to decision detail. Accommodation browsing is useful as a reference for scannable choices, but it is not a direct dashboard template. For your own summary card, identify the facts needed before choosing the next screen and keep the detailed evidence one clear action away. A polished image alone does not create trust or establish that a booking is suitable.
- Pinterest — organize a collection. Pinterest boards illustrate grouping saved ideas into meaningful collections. This can inform how related dashboard items are organized. A dense visual grid is less suitable when users must compare exact values or find one urgent exception; choose the grouping around that task.
- Mailchimp — move from summary to report. Its mobile automation reporting provides a useful reference for summary data and flow details. A reporting dashboard should explain the scope of a measure and make its detailed context available. Do not assume a prominent total has meaning without a date range, definition, or relevant comparison.
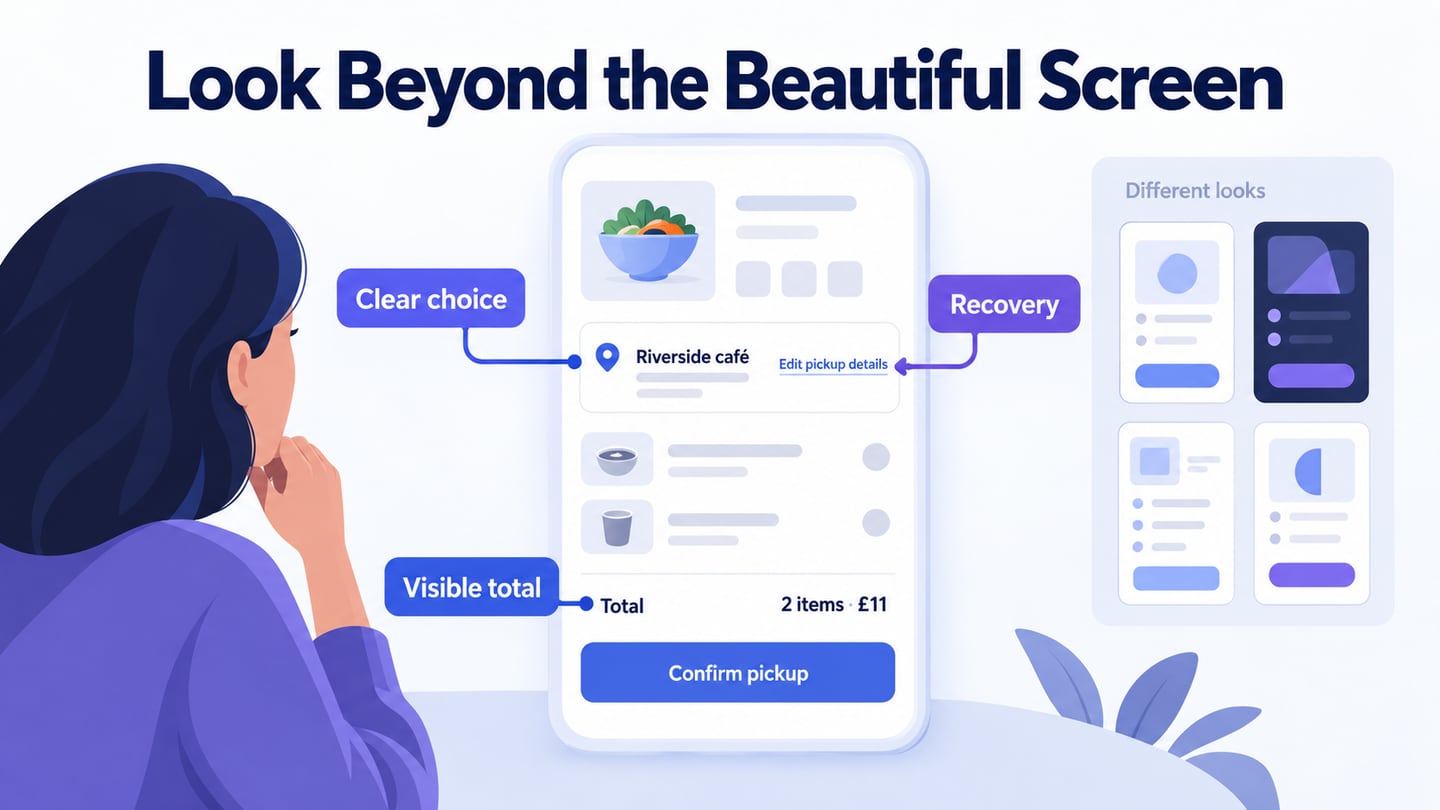
- Dribbble — use visual references critically. Design showcases can help explore typography, spacing, and card hierarchy. They do not prove that an interface supports real data, access permissions, long labels, or failure states. Treat a showcase as a visual hypothesis and test the underlying task in your own prototype.
How to Design a Mobile Dashboard
Start with a short list of decisions the person needs to make on mobile. Mockitt can help arrange their summaries and connect them to a detail view. The original screenshot is retained to show an earlier linked-screen editor; the new example below supplies a dashboard-specific task.
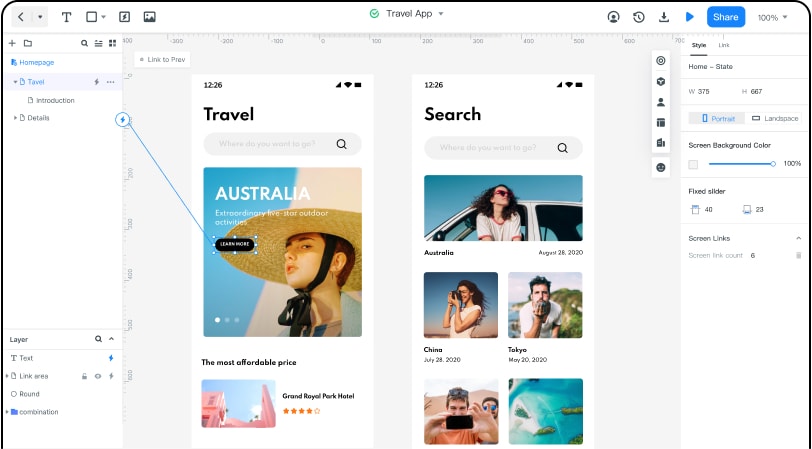
Use reusable cards and text roles to keep related data consistent. Define what each value means and where it comes from before using it in a prototype. Shared preview helps the team discuss the flow, but it does not validate a live data source or automatically generate a complete application.
Follow the original four stages—create, design, preview, and share—with these dashboard-specific checks.
1. Create a project for the mobile task
Choose a suitable viewport and name the primary decision. Include realistic long labels and the data states the person may encounter while moving between places or networks.
2. Design the summary and its details
Build the main summary first, then the destination reached from its most important card.
- Add cards and controls with distinct roles. Put the item needing attention where it can be found, and keep ordinary status visible without giving every number equal emphasis.
- Connect summary items to the correct detail state. Make the destination label specific enough that someone can predict what they will see.
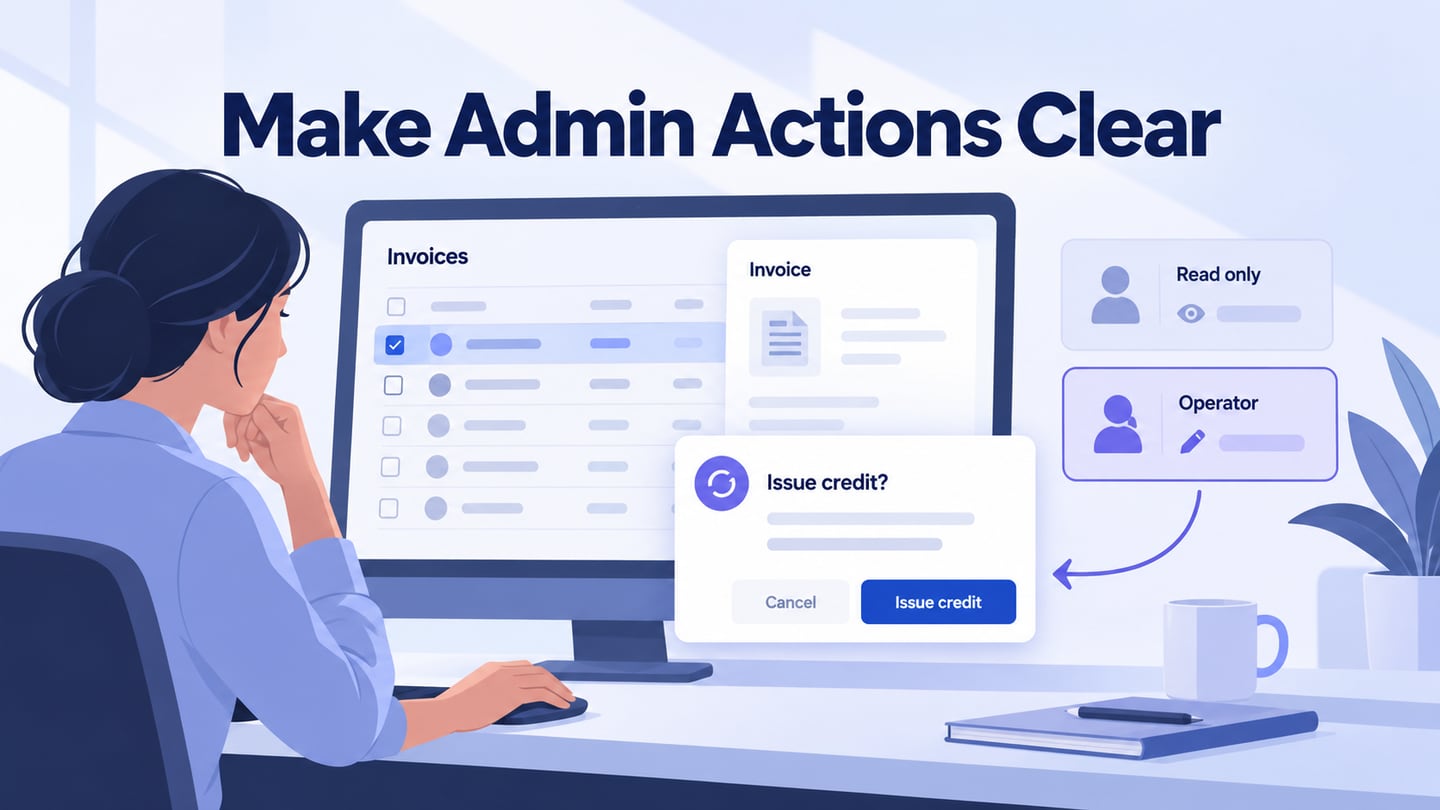
- Add notes for data definitions, freshness, permissions, and unavailable values. These rules belong in the design discussion even when the prototype uses static sample data.
- Use changes and motion only to explain a meaningful state transition. A loading animation should not imply that a server has completed an action.
3. Preview the dashboard workflow
Preview the layout on a small screen and follow the primary decision through to its details. Check whether long content remains readable, the next action is reachable, and an unknown value is distinct from zero.
Prototype an exception-first mobile dashboard
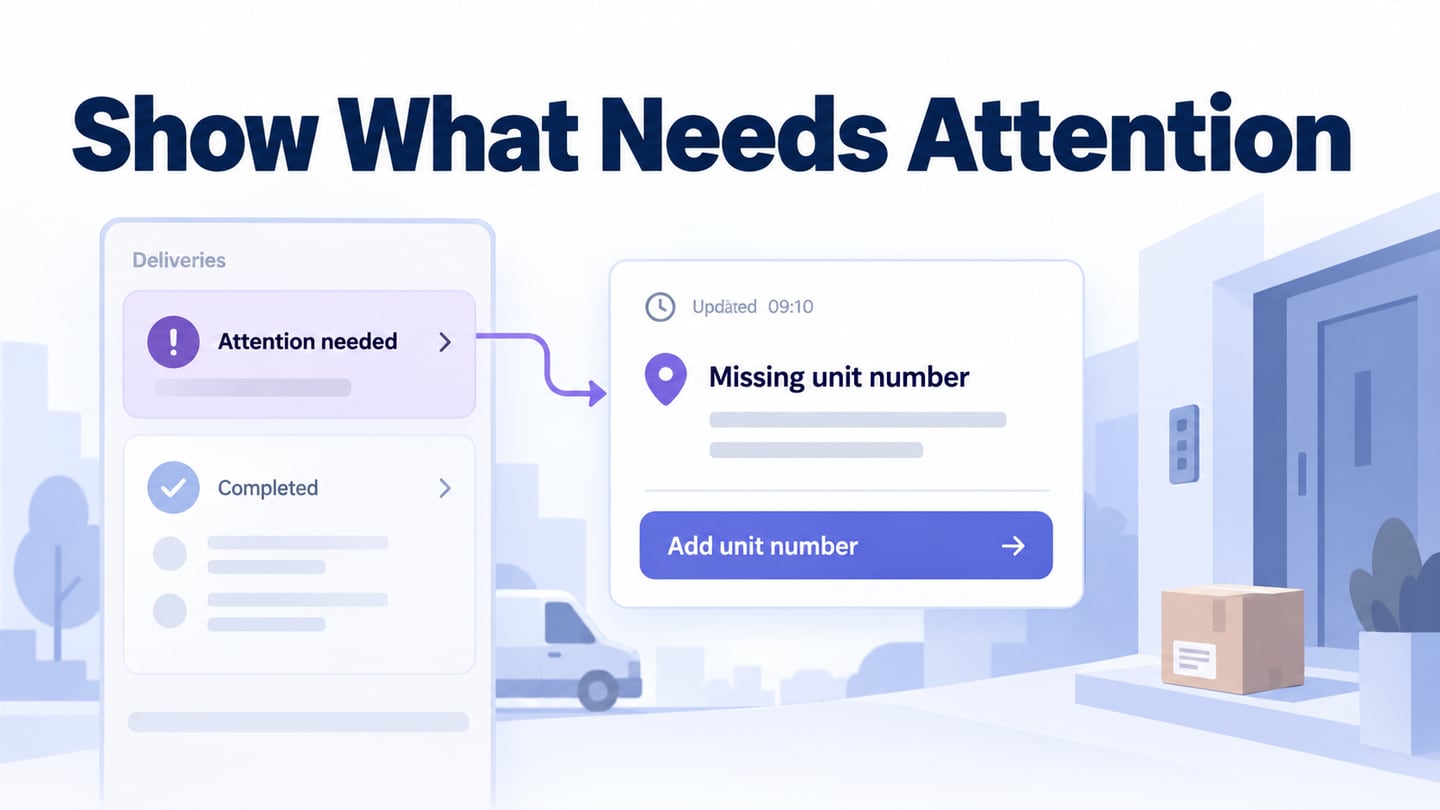
For an illustrative delivery coordinator, the first question is whether any delivery needs attention. Show Today’s deliveries, Updated 09:10, Attention needed: 1, and Completed: 8. Opening the attention card reveals Delivery D-104 with Unit number missing and a Review address action. These are sample records for review, not measured business results.
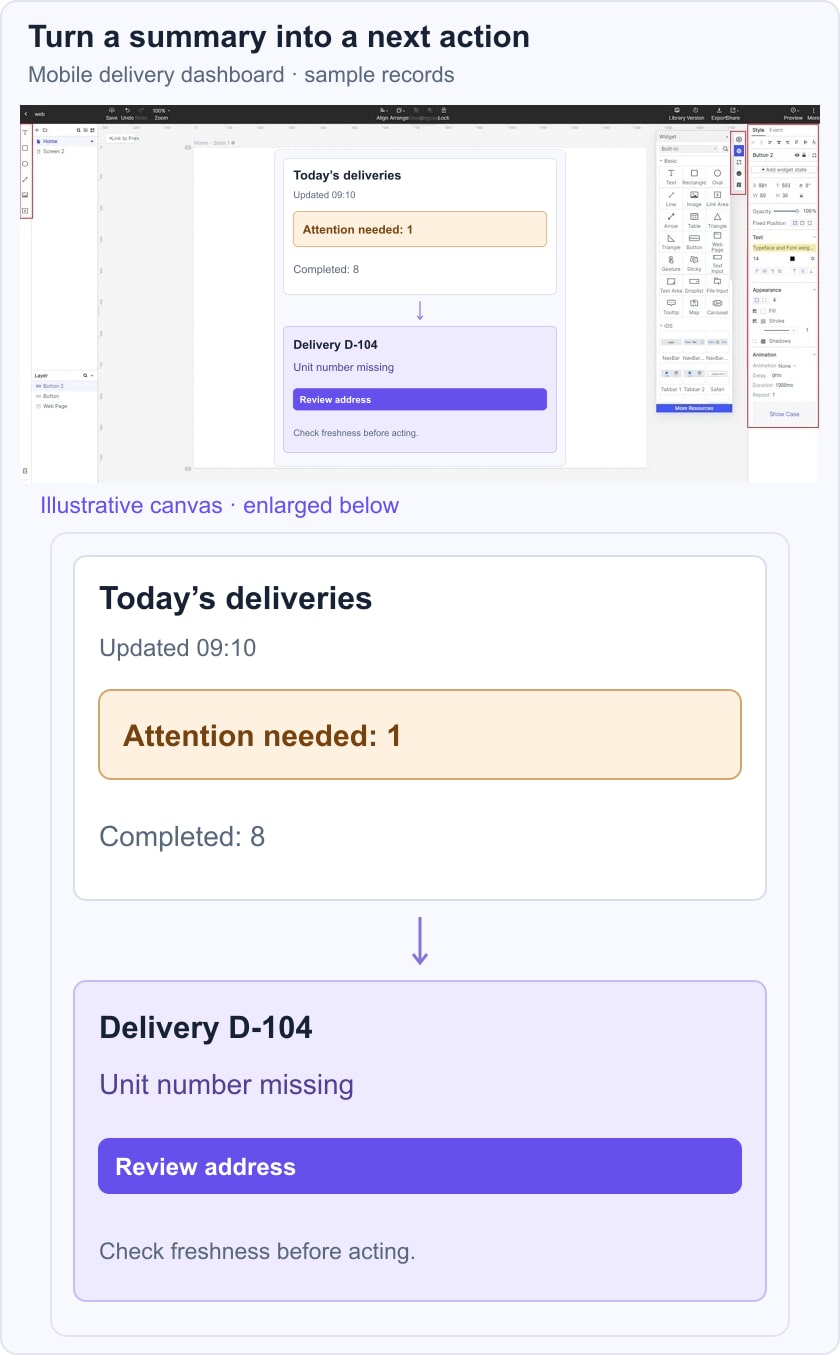
Include a stale-data state so the update time is not mistaken for a live guarantee. Then create a dashboard-to-detail prototype and ask a reviewer to find the affected delivery and explain the next action. If they open completed items first or cannot tell what is outdated, revise the hierarchy or wording before adding more charts.
4. Share the prototype and record decisions
Share the prototype with the people responsible for the workflow and data. Ask them to verify the meaning of the summary, the exception, and the next action. Keep questions about live permissions, synchronization, and server outcomes explicit for implementation.
A useful mobile dashboard earns its space by answering a real question. Keep the summary focused, make freshness and uncertainty visible, and provide a clear route from the most important status to the action it requires.