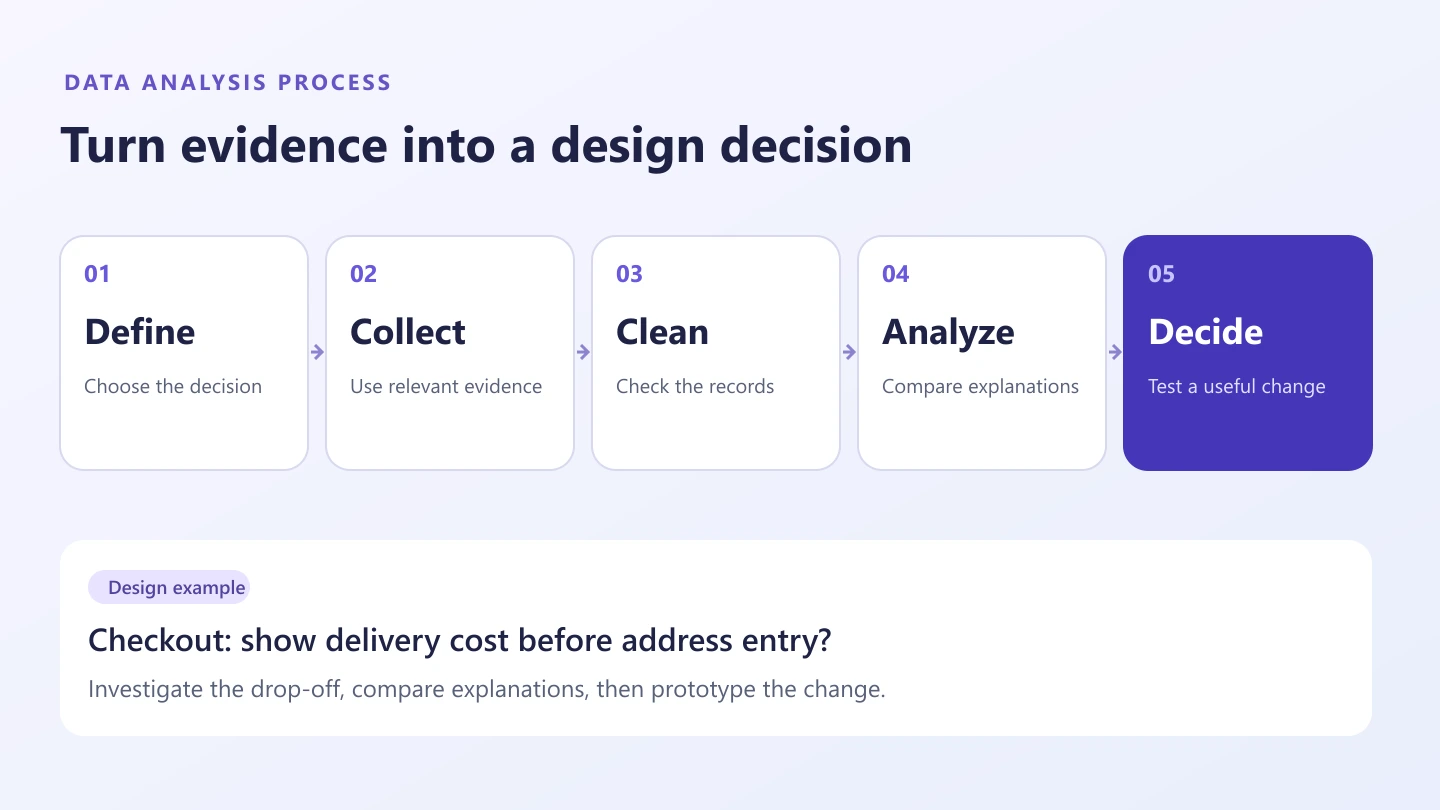
The data analysis process turns a question into evidence for a decision: define the question, collect relevant data, check its quality, analyze it, and interpret the result. The useful output is a supported answer with clear limits—not simply a chart or a larger collection of customer data.
For a product team, the question might be, “Why do shoppers leave the delivery step?” A spreadsheet or analytics tool can calculate the measures; a shared Mockitt whiteboard can organize observations, competing explanations, and proposed changes. Keep the original data and calculations in their appropriate systems.
This guide follows that delivery-step example through five stages, then explains which analysis methods answer which questions.
What Is the Data Analysis Process?
Data analysis involves examining, cleaning, organizing, and interpreting information to answer a defined question. Modeling may be part of the work, but a useful analysis does not always require a predictive model. Counting correctly, separating meaningful groups, or studying interview comments may be enough.
Businesses use analysis to understand changing demand, investigate a process problem, or compare options. The same reasoning helps a UX team connect a reported problem to a specific screen. An increase in exits, for example, tells you where to investigate; it does not establish why people left.
Before collecting more information, agree on the decision that the answer will support. “Understand our customers” is too broad to guide a practical analysis. “Decide whether delivery-price information belongs before address entry” gives the team a concrete choice.
Five Steps in the Data Analysis Process
1. Define Why You Need the Analysis
Start with a specific question, the population it concerns, and the period you will examine. Identify the measure before comparing results. A checkout completion rate might use completed orders divided by checkout starts; a delivery-step completion rate uses a different denominator.
Useful business questions include how to reduce production costs without lowering quality, where sales opportunities are being lost, or how customers understand a service. Each needs an observable measure and a boundary.
For the delivery example, define the task as completing a purchase on mobile. Ask whether people can find the delivery charge before submitting an address. Record other possible explanations, including unavailable locations, unexpected delivery dates, and technical failures, so the analysis does not begin with a predetermined answer.
2. Collect Data That Can Answer the Question
Internal sources may include product events, support tickets, research notes, and order records. External reviews can reveal useful concerns, but their authors may not represent your current users. Collect only the information needed for the investigation and follow the consent, access, and retention arrangements that apply to it.
Combine sources according to their purpose. Event data can show a pattern of exits; session observations can reveal what someone tried; a support message can describe a concern. Do not treat a click as proof of motivation or an interview comment as a population-wide frequency.
In this example, collect delivery-step starts and completions for the same period, note which events are missing, and review relevant support messages. Observe the checkout task with people who match its audience. Use fictional addresses when preparing the prototype.
3. Check and Clean the Data
Check for duplicate records, inconsistent labels, missing values, impossible timestamps, and changes to event definitions. Keep an unchanged source copy and record each cleaning rule. There is no fixed percentage of project time that every team must spend on this stage.
An unusual observation is not automatically an error. A very long completion time might be a logging fault, an interruption, or a real accessibility problem. NIST's guidance on outliers distinguishes erroneous observations from unusual values that warrant investigation. Removing every inconvenient result can hide the problem you need to understand.
Suppose a fictional export contains 100 delivery-step starts, including five duplicated events. After applying a documented duplicate rule, 95 starts remain. If 57 resulted in completion, the descriptive rate is 57 ÷ 95, or 60%. These numbers illustrate the calculation; they are not a Mockitt customer result.
If the completion event fails to fire for some browsers, the rate is not reliable until you understand that gap. Label missing information rather than quietly treating it as a failed checkout.
4. Look for Patterns and Test Explanations
Begin with simple summaries and visual inspection. Compare like with like: the same event definitions, comparable periods, and relevant audience groups. A combined total can hide a problem limited to one device or delivery region.
For the example, compare observed difficulties with the screen where they occurred. Group comments such as “I need the shipping cost first” separately from “My address was rejected.” Both can cause abandonment, but they need different changes.
Exploratory patterns help form hypotheses. They do not establish cause by themselves. A suitable controlled experiment can answer some causal questions; a focused usability session can expose comprehension problems without estimating their prevalence across all customers.
5. Interpret the Result and Choose the Next Action
Explain what the evidence supports, what remains uncertain, and what decision follows. Include the denominator, timeframe, exclusions, and important limitations near the result. Avoid presenting a precise percentage without explaining what was counted.
A useful conclusion might be: “Several observed participants searched for delivery costs before entering an address. We will compare an earlier cost estimate with the existing sequence.” That is stronger than “The address form causes all abandonment,” which the evidence does not establish.
Assign an owner and a next check. After a change, inspect both the intended outcome and possible tradeoffs, such as people misunderstanding an estimated charge as a final price.
Which Analysis Method Fits the Question?
1. Text Analysis
Text analysis examines written or transcribed material for themes, meanings, or recurring issues. For support messages, create clear categories, retain context, and check ambiguous cases. Automated classification can assist, but a label still needs validation. Text analysis is not a synonym for every form of data mining.
2. Statistical Analysis
Descriptive statistics summarize observed data using counts, proportions, distributions, or measures such as the median. Inferential statistics use a sample to estimate or test claims about a broader population under stated assumptions. A convenient sample does not become representative simply because software produces a confidence interval.
3. Diagnostic Analysis
Diagnostic analysis investigates possible explanations for a result. It may compare segments, trace a workflow, or examine when a change occurred. In the checkout example, distinguish price uncertainty from address validation and network problems before choosing a remedy.
4. Predictive Analysis
Predictive analysis estimates an unknown outcome from available information. It does not reveal the future with certainty. Evaluate predictions on appropriate held-out data, consider changing conditions, and communicate uncertainty. It is not simply the opposite of diagnostic analysis.
5. Prescriptive Analysis
Prescriptive analysis helps compare actions against objectives and constraints. A recommendation depends on the assumptions, costs, and priorities supplied to the process. It is useful when the team needs to choose among alternatives, rather than merely describe what happened.
Turn an Analysis Finding into a Reviewable Design
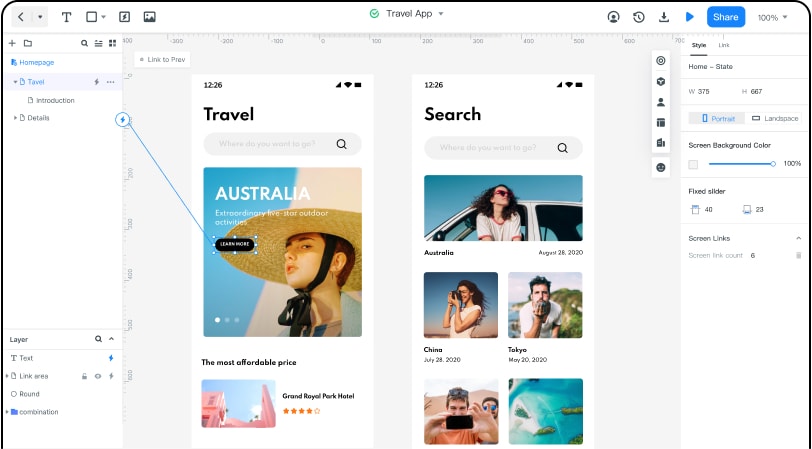
Use analytical tools for calculations and source records. Use a design workspace for the next question: what should the user see or do differently? Mockitt supports creating interface screens, connecting interactions, and sharing a prototype for review; it does not replace a validated analytics implementation.
Organize the Finding Before Drawing
Keep three items together: the observed issue, the proposed explanation, and the design response. For this example: people looked for cost information; the team suspects the sequence hides it too long; the proposed response is an early delivery estimate.
Create a Focused Clickable Comparison
Prepare the delivery screen, an estimate state, and a review screen in a Mockitt prototype. Connect the actions needed for the task. Keep other content consistent so reviewers can concentrate on the placement and wording of the estimate.
Reuse the Relevant Design Material
Reuse accurate screens and assets already available to the team. Rebuilding the entire product is unnecessary when the decision concerns one step. Include the missing-information and error states that could change the result.
Review the Interaction and Record the Decision
Ask someone to work out the delivery cost and continue to review. Observe whether they understand what is estimated and what is final. Record the specific screen and wording behind each issue, then return to the analysis question. A clearer prototype is evidence for another design decision—not proof of a production conversion increase.